
Where to Enter Bitcoin — Right on the Level
One of the most common beginner questions is "where exactly do I enter?". Most people enter by eye — on a feeling that it is "already cheap" or "about to fly." Such entries are random, and so is the result. But an entry point can be defined not by intuition but by concrete levels that actually move price. Then every trade gets a clear entry, target and stop — the entry lands right on the level.
Why the entry is built on levels, not intuition
On a short horizon, price is moved not by the crowd’s emotions but by options levels — spots where a large volume is stacked and where a large player is forced to act. At such levels price stalls, gets rejected, or, on the contrary, accelerates after a breakout. That is why they give you an entry point with logic, not a guess by eye.
The idea is simple: enter at a support level (the floor), target the nearest resistance level (the ceiling), and place the stop just beyond the level. When your entry, target and stop are tied to real levels, every trade becomes calculated rather than guessed.
What a precise entry looks like
The screenshot shows an ETH trade with levels marked in advance. You can see the entry point, the target zone (green, take-profit) and the stop zone (red, beyond the level). The risk is small — down to the nearest level — while the profit potential is several times larger. That is how you build a high reward-to-risk ratio: for one unit of risk the trade takes several times more.
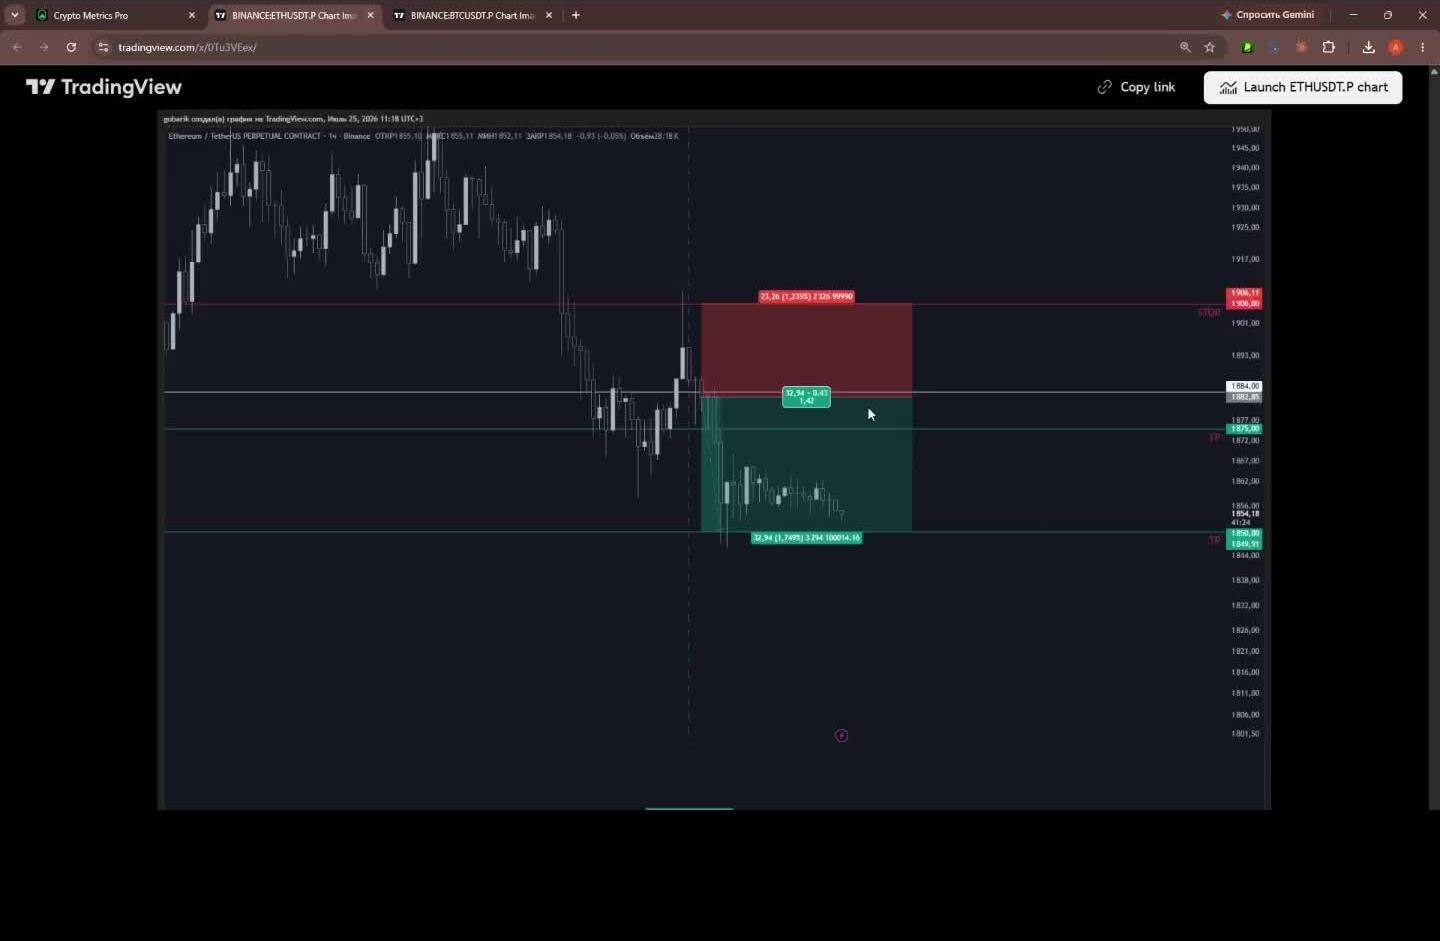
Trade markup: entry point, target (green zone) and stop beyond the level (red zone). Risk is several times smaller than the potential profit.
Verifiable statistics, not promises
The key difference of the level-based approach is that the result can be verified. All trade statistics are collected in the open Trader Terminal section on CryptoMetrics Pro: for each day you can see the setup and the outcome (WIN/LOSS) for both BTC and ETH. For the week shown, the win rate was 86% on Bitcoin and 80% on Ether. It is not a promise from the system — it is open statistics that anyone can see.
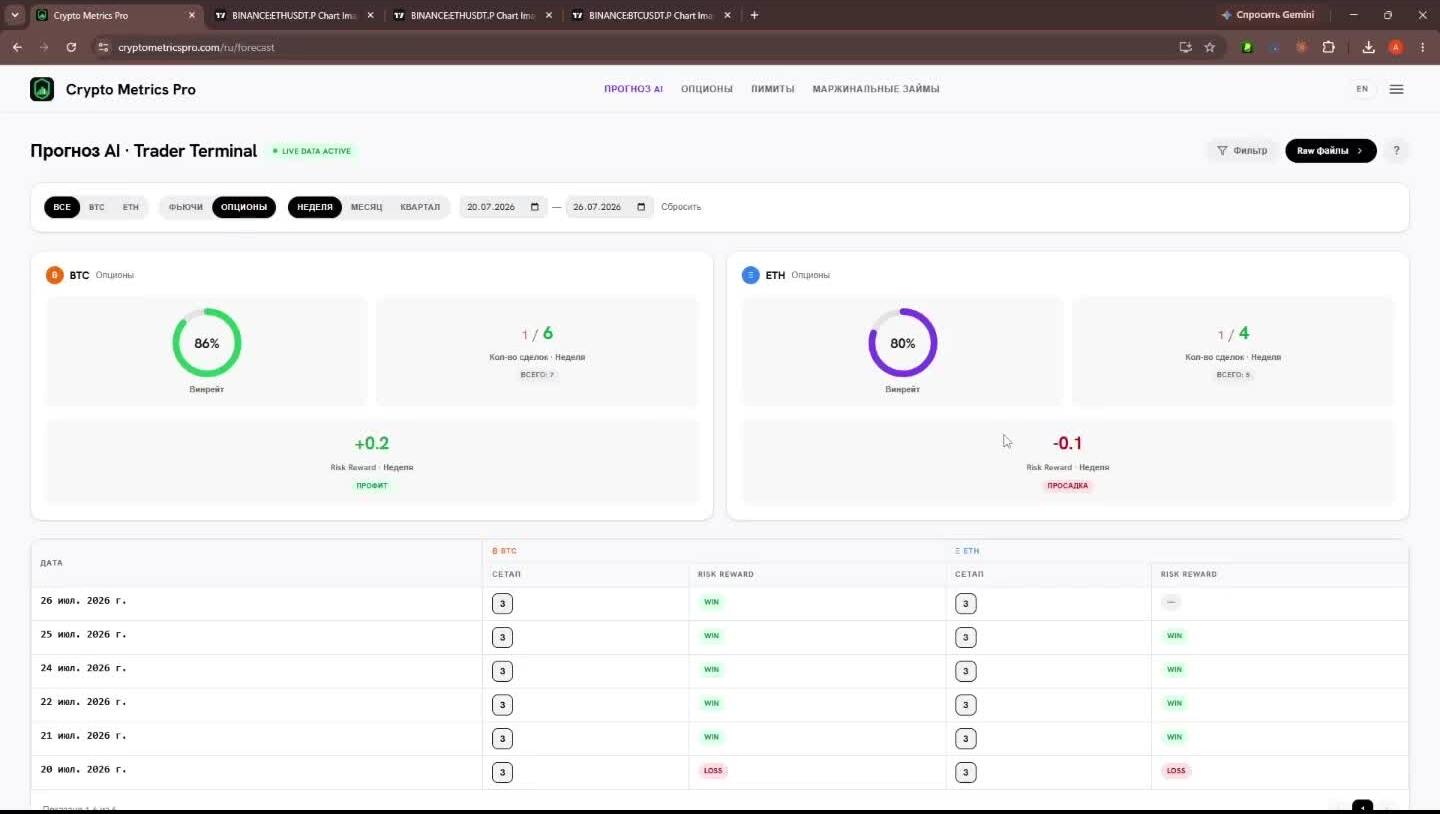
The open Trader Terminal section: 86% (BTC) and 80% (ETH) win rate for the week and a daily table of trades. CryptoMetrics Pro.
Where to find the levels for entry
The levels used to mark an entry are visible on the CryptoMetrics Pro dashboard. As a beginner you only need four reference points:
- Options walls (profile bars). A wall below price is support (a long entry zone); a wall above price is resistance (target / exit zone).
- Flip Point. The line above which the move strengthens and below which it fades. Helps you choose the side of the trade.
- Max Pain. The price the market is pulled toward by expiry — a frequent reference for the target.
- Trader Terminal (open statistics). Ready-made setups and their daily results — you can cross-check and learn from real examples.
Precise-entry checklist
- I do not enter "by eye" — I look for the nearest options level.
- The entry is tied to a support level, the target to the nearest resistance.
- The stop sits just beyond the level — the risk is small and known in advance.
- I check that the potential profit is several times larger than the risk.
- I cross-check with the open Trader Terminal statistics instead of taking it on faith.
In short
Entering Bitcoin "right on the level" means defining your entry, target and stop from options levels, not from intuition. Enter at support, target resistance, place the stop beyond the level — that keeps risk small and profit several times larger. And these are not promises: the trade statistics are open in the Trader Terminal section and can be verified. To see where those levels sit on Bitcoin right now, check the CryptoMetrics Pro dashboard.
See BTC and ETH levels live in the AI Forecast module.
Open moduleMore guides
This material is educational and is not individual investment advice. Trading cryptocurrencies and derivatives carries a high level of risk.