
How to Tell a False Breakout from a Real One
Sound familiar? Price approaches an important level, pokes through it, you jump into a "breakout" trade — and a couple of minutes later price snaps back and your stop is already gone. This is the classic false-breakout trap that costs thousands of beginners money. The good news: a real breakout differs from a fake one by a single simple sign, and you can learn to spot it in five minutes.
The key sign — how the candle closes
What matters is not whether price touched the level, but how the candle closed. A real breakout is when the candle closes with its body beyond the level, not just pierces it with a wick. The body is the range between the open and close of the candle (the wide part). The wick (shadow) is the thin "tail" above or below — it shows where price was pushed but failed to hold.
Real breakout: the candle closed with its body beyond the level. The level is truly broken. The former resistance now acts as support, and the next target is the nearest options wall above.
False breakout: the candle only pierced the level with a wick and came back into the range. The level held, and whoever entered on the poke gets "shaken out" by the reversal. That is exactly what the trap looks like.
What it looks like on the chart
In the screenshot below, price approaches the level but closes under it — the body did not break the level, only a wick remains above. Until a candle closes with its body beyond the level, there is no breakout, and it is too early to enter on a "breakout."
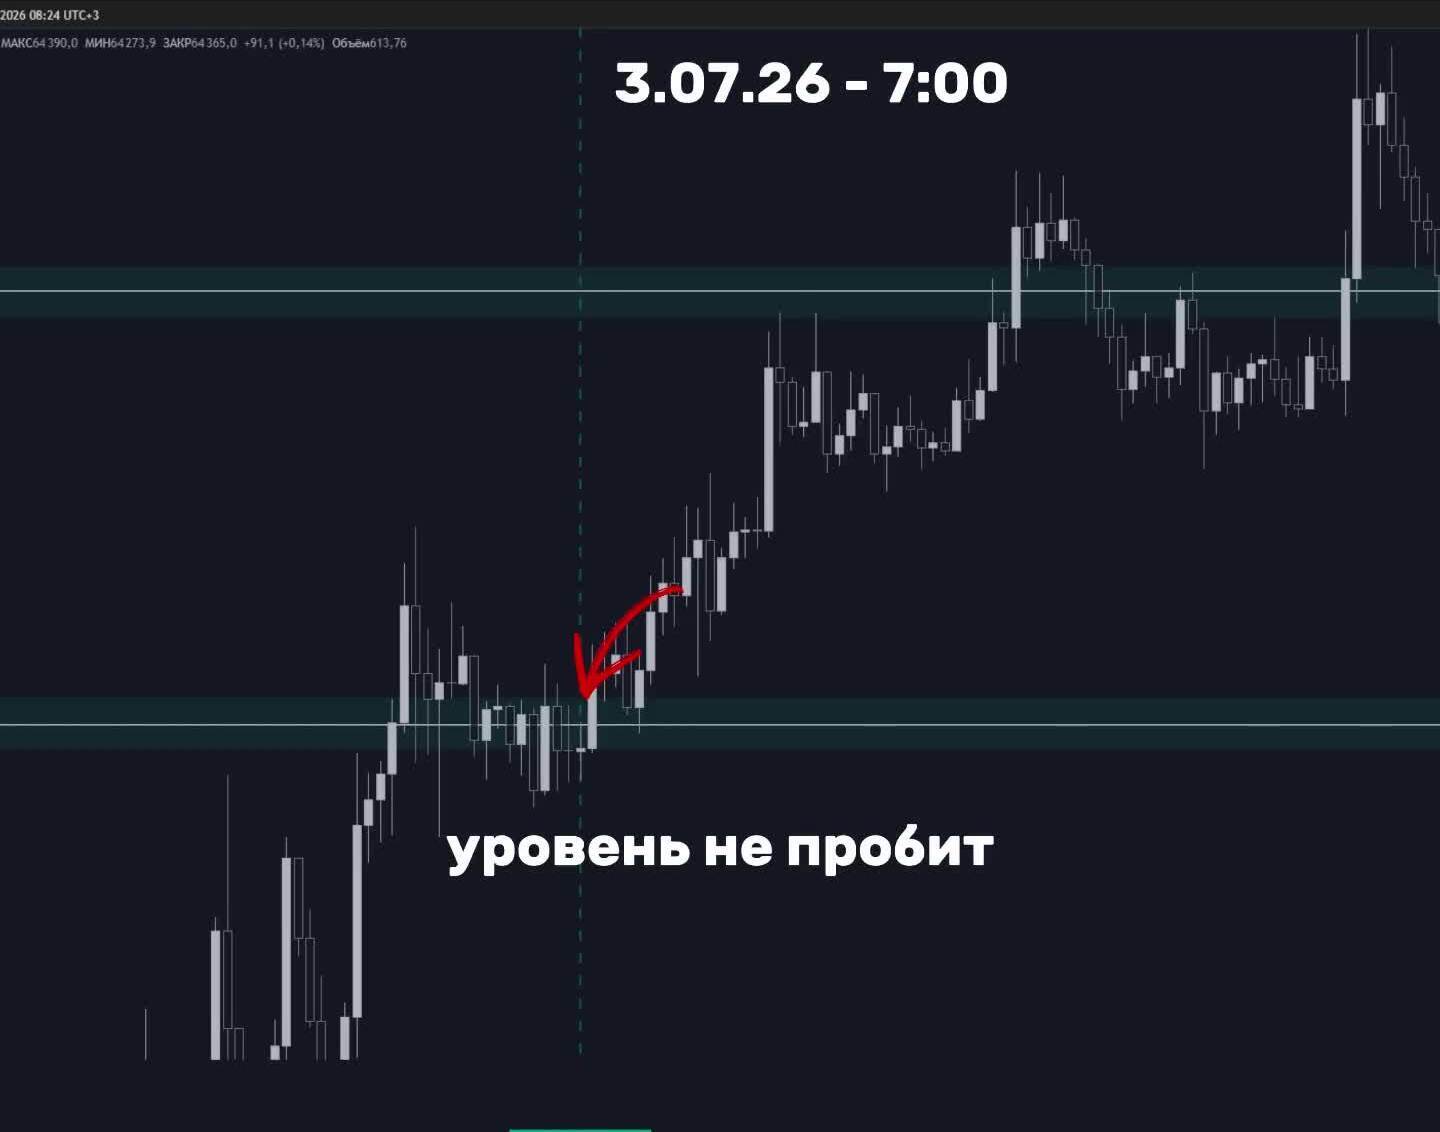
Level not broken: price touched it with a wick, but the close stayed inside the range — a false-breakout signal.
Example: what to do after a breakout
Once a breakout is confirmed by the close, you need to know where price goes next. This is where the CryptoMetrics Pro dashboard helps. In the screenshot BTC has already held above the level (spot around $61,907), and the next large options wall is $63,000 (the "target" arrow points to it). That is the logical target of the move after a real breakout.
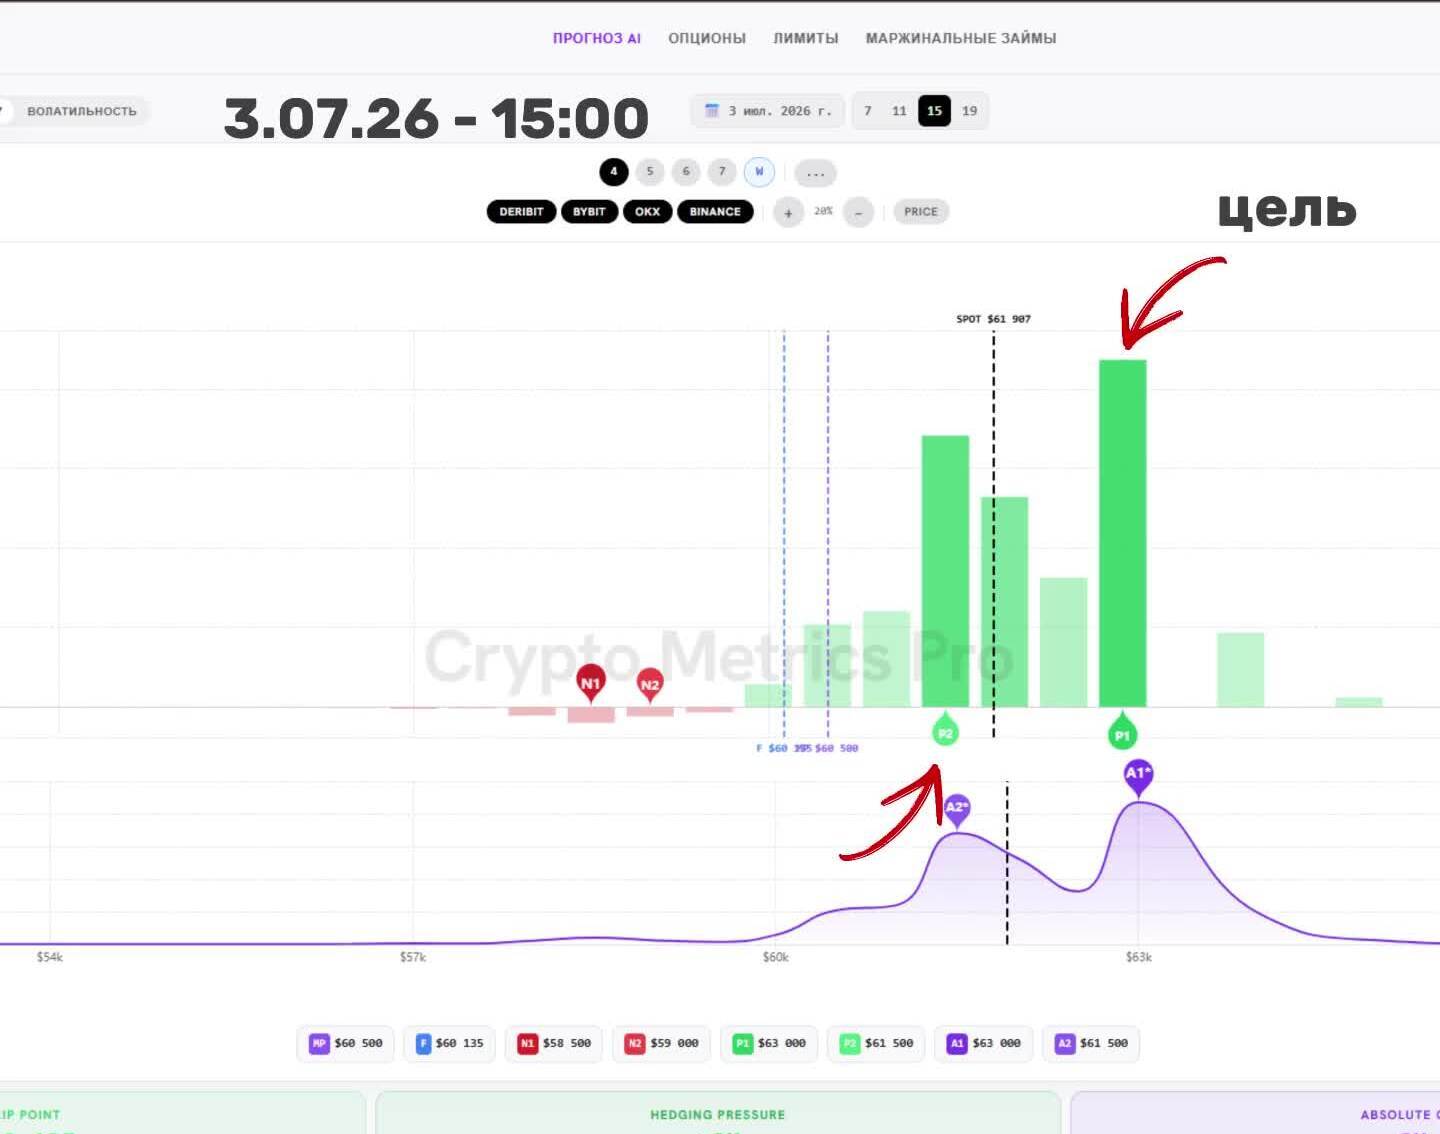
After a confirmed breakout the target is the nearest options wall above ($63,000). CryptoMetrics Pro dashboard.
Where to find the levels
The candle tells you whether the breakout happened. Where price goes next, and where to expect the next reversal, is shown by the CryptoMetrics Pro dashboard. As a beginner you only need four readings:
- Options walls (profile bars). The tallest bars are the levels where price stalls most often. Once one wall breaks, the nearest target is the next wall.
- Flip Point. The line above which the market tends to "accelerate" and below which it tends to "fade." Helps you gauge the strength of the move.
- Max Pain. The price the market often drifts toward by options expiry. It acts like a magnet.
- Hedging Pressure. Shows whether large players are smoothing the move out or accelerating it.
Checklist: breakout or trap
- I waited for the candle CLOSE — I did not enter on an intraday poke.
- The candle body closed BEYOND the level, not just a wick.
- On the retest, former resistance held as support.
- I set a target — the next options wall in the breakout direction.
- If the candle pierced the level and returned into the range — it is a false breakout, and I cancel the entry.
In short
Do not confuse a poke with a breakout. A real breakout is confirmed when the candle closes with its body beyond the level; after it, former resistance becomes support and the target is the next options wall. A wick poke that returns into the range is a false breakout and a trap. To see where those walls sit on Bitcoin right now, check the CryptoMetrics Pro dashboard.
See BTC and ETH levels live in the Options · GEX module.
Open moduleMore guides
This material is educational and is not individual investment advice. Trading cryptocurrencies and derivatives carries a high level of risk.