
How the System Sees in Advance Where Bitcoin Will Go
"Where is Bitcoin going?" is a question a beginner usually answers with intuition: look at the chart, "feel it," and enter. The problem is that intuition gives you neither an entry point, nor an exit moment, nor a stop — only hope. The system works differently: it shows in advance a concrete entry point, a concrete moment to exit, and a clear stop. No magic — only the levels that actually move price.
Why this is not guessing
The core idea is to forget about intuition. On a short horizon, price is moved by options levels — spots where a large volume is stacked and where a large player is forced to act. It is these levels, not hunches, that set where price reverses and where it accelerates.
These levels are gathered by artificial intelligence. It builds the options chain (a map of large volumes by strike) on the 1-hour timeframe by itself and turns it into a ready setup: where the entry is, where the target is, where the stop is. For example, one BTC setup is a volatility sale: selling Put options at the $62,500–$63,000 strike or Call options at the $65,000 strike. All that is left for you is to check the logic and decide whether to take the trade.
A concrete trade: entry, target, stop
The output of the system is not an abstract "up or down" forecast but a marked-up trade. In the ETH screenshot the entry point, the target zone (green, take-profit) and the stop zone (red) are marked in advance. Everything is tied to levels, so the risk is small and known in advance, while the profit potential is several times larger.
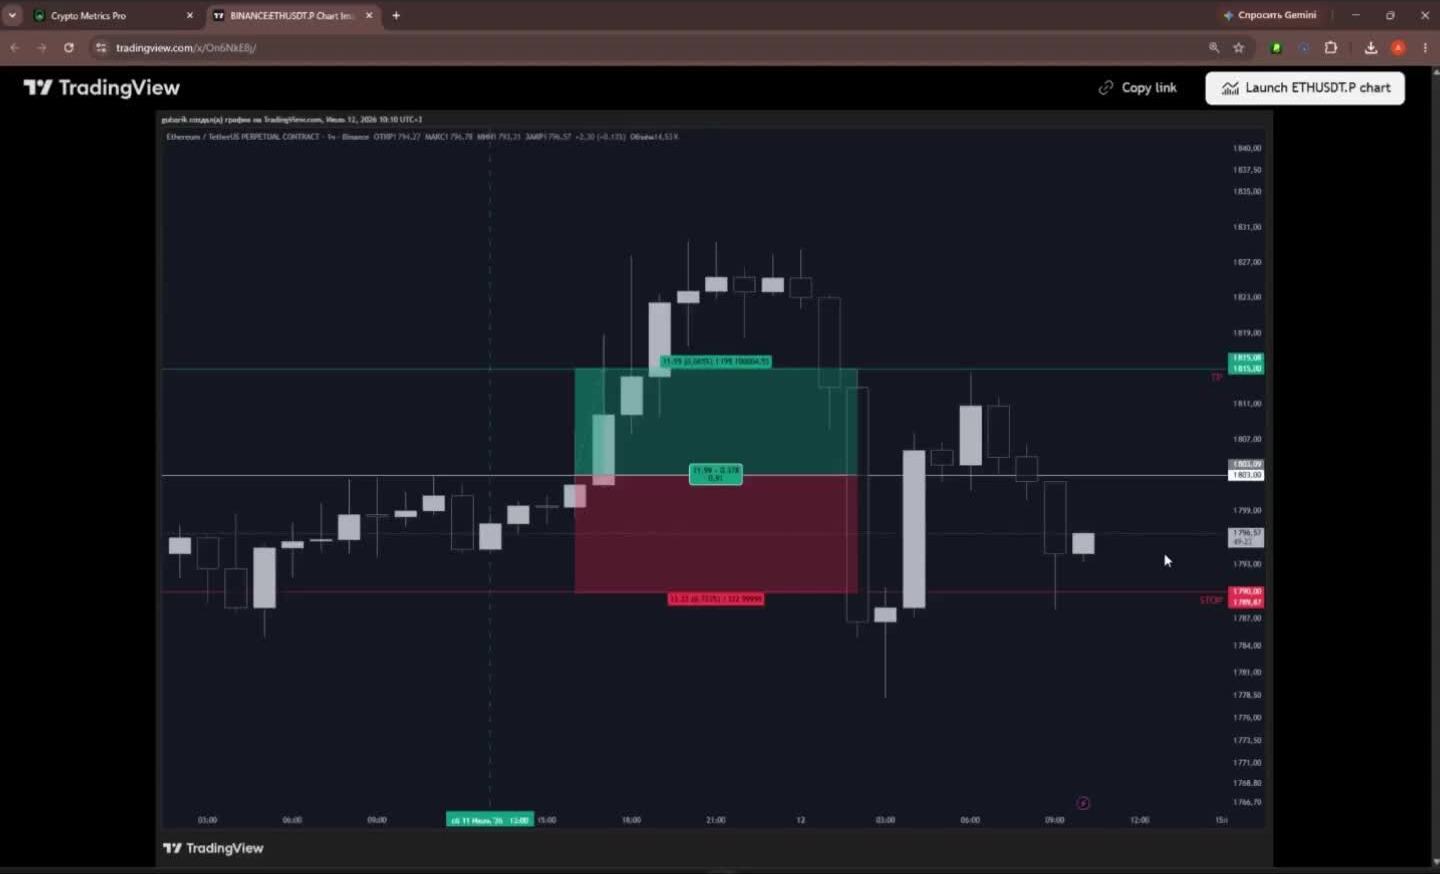
A ready ETH trade: entry point, target (green zone) and stop (red zone), calculated from levels.
The result can be verified
Since the trades are concrete, their outcome is easy to count. The Trader Terminal section on CryptoMetrics Pro holds an open results summary: the win rate and reward-to-risk ratio for BTC and ETH, plus a daily table of setups marked WIN/LOSS. For the week shown — 81% on Bitcoin and 87% on Ether, with a reward-to-risk ratio of +10.08 and +12.1. It is not a promise but statistics anyone can see.
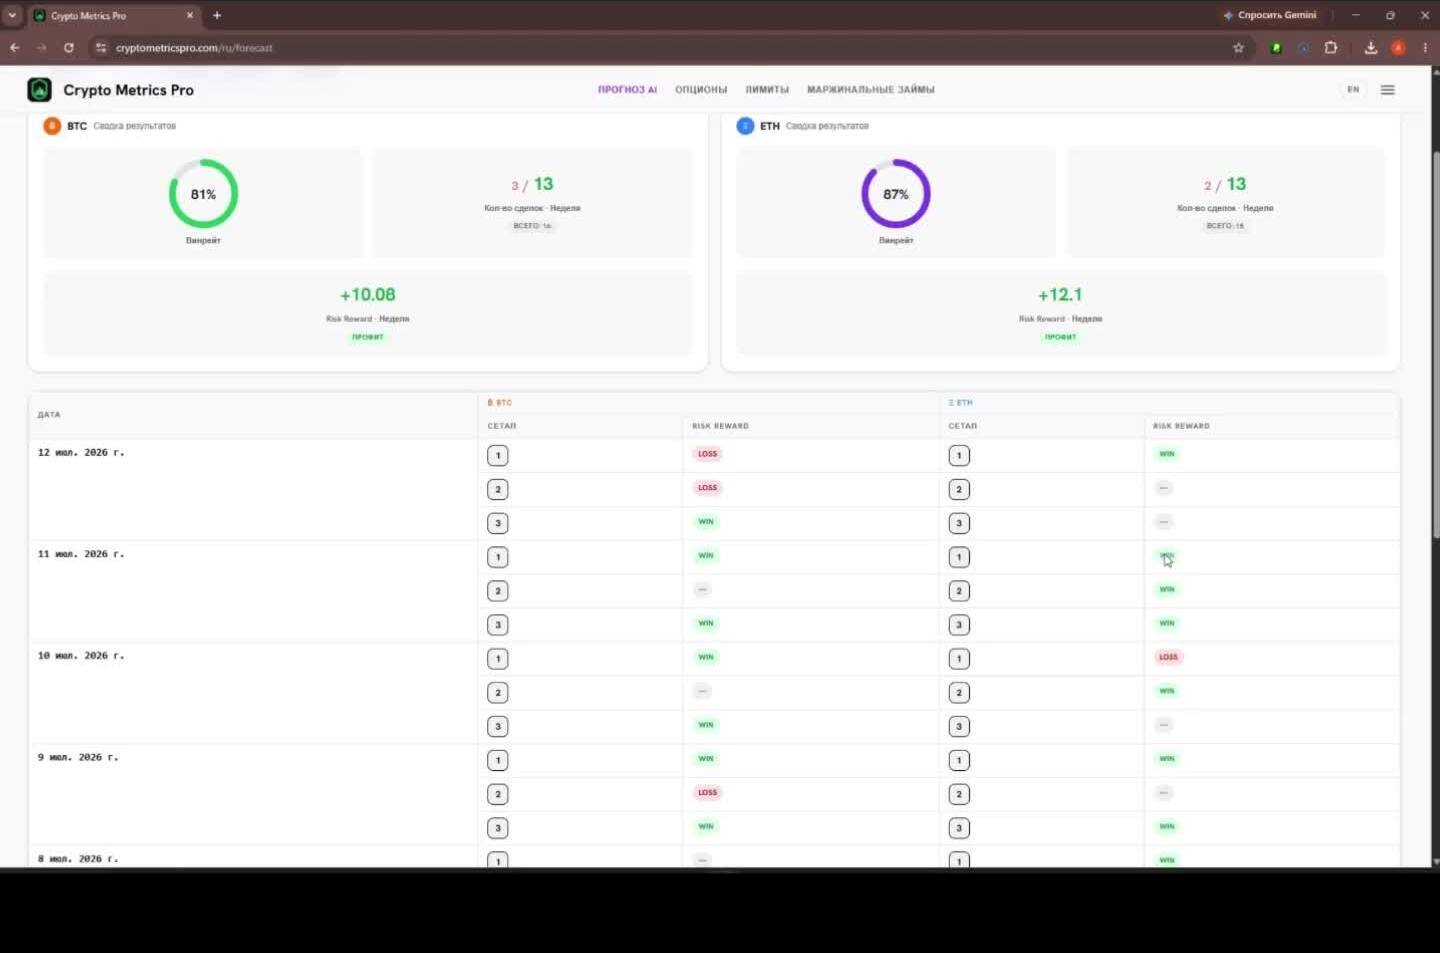
Open results summary: 81% (BTC) and 87% (ETH) win rate, R:R +10.08 and +12.1, daily trade table. CryptoMetrics Pro.
What a beginner should look at
To understand where the system gets its points, four reference points on the dashboard are enough:
- Options chain / walls (profile). Large volumes by strike — the very levels that move price. Below price is support, above price is resistance.
- Forecast AI (ready setup). The AI translates the chain into a concrete trade: entry, target, stop.
- Flip Point and Max Pain. Help you read the side of the move and where the market is pulled by expiry.
- Trader Terminal (open statistics). Daily setup results — you can cross-check and learn from real examples.
Checklist: trade by the system, not by intuition
- I do not enter "on a feeling" — I take a ready entry point from the system.
- The trade has a concrete target and stop tied to levels.
- I check the setup logic against the options chain instead of taking it on faith.
- I make sure the potential profit is several times larger than the risk.
- I cross-check with the open Trader Terminal statistics.
In short
The system "sees" Bitcoin in advance not through magic but because artificial intelligence gathers the options chain on the 1-hour timeframe and turns it into a concrete trade — with an entry point, a target and a stop. Intuition is not needed: all that is left is to check the logic and decide. And the result is open in the Trader Terminal section and can be verified. To see where those levels sit on Bitcoin right now, check the CryptoMetrics Pro dashboard.
See BTC and ETH levels live in the AI Forecast module.
Open moduleMore guides
This material is educational and is not individual investment advice. Trading cryptocurrencies and derivatives carries a high level of risk.