
Limit Imbalance: 4 Trades a Week on the Candle Chart
To trade from the order book, you do not have to stare at a complex screen full of orders. The limit-imbalance signal can be plotted right on the familiar candle chart — and give you a few clean trades a week. The video shows a simple method: a limit-imbalance signal on 1H, confirmation by a rejection block on 4H, and a limit entry at the wick with the stop by the candle body.
What limit imbalance is
The order book holds limit buy and sell orders. When the volume on one side clearly outweighs the other, a limit imbalance appears. That is the signal: the side with more orders usually "holds" price. The CryptoMetrics Limits indicator plots this imbalance right on the candle chart — as green and red zones, so you do not have to peer into the raw order book.
The rejection block
The signal is confirmed by a rejection block. It looks like candles with long wicks and aligned bodies: price tried to break the level but got pushed back. Long wicks = rejection, bodies at the same level = a defended zone. That is the place to enter against the failed breakout.
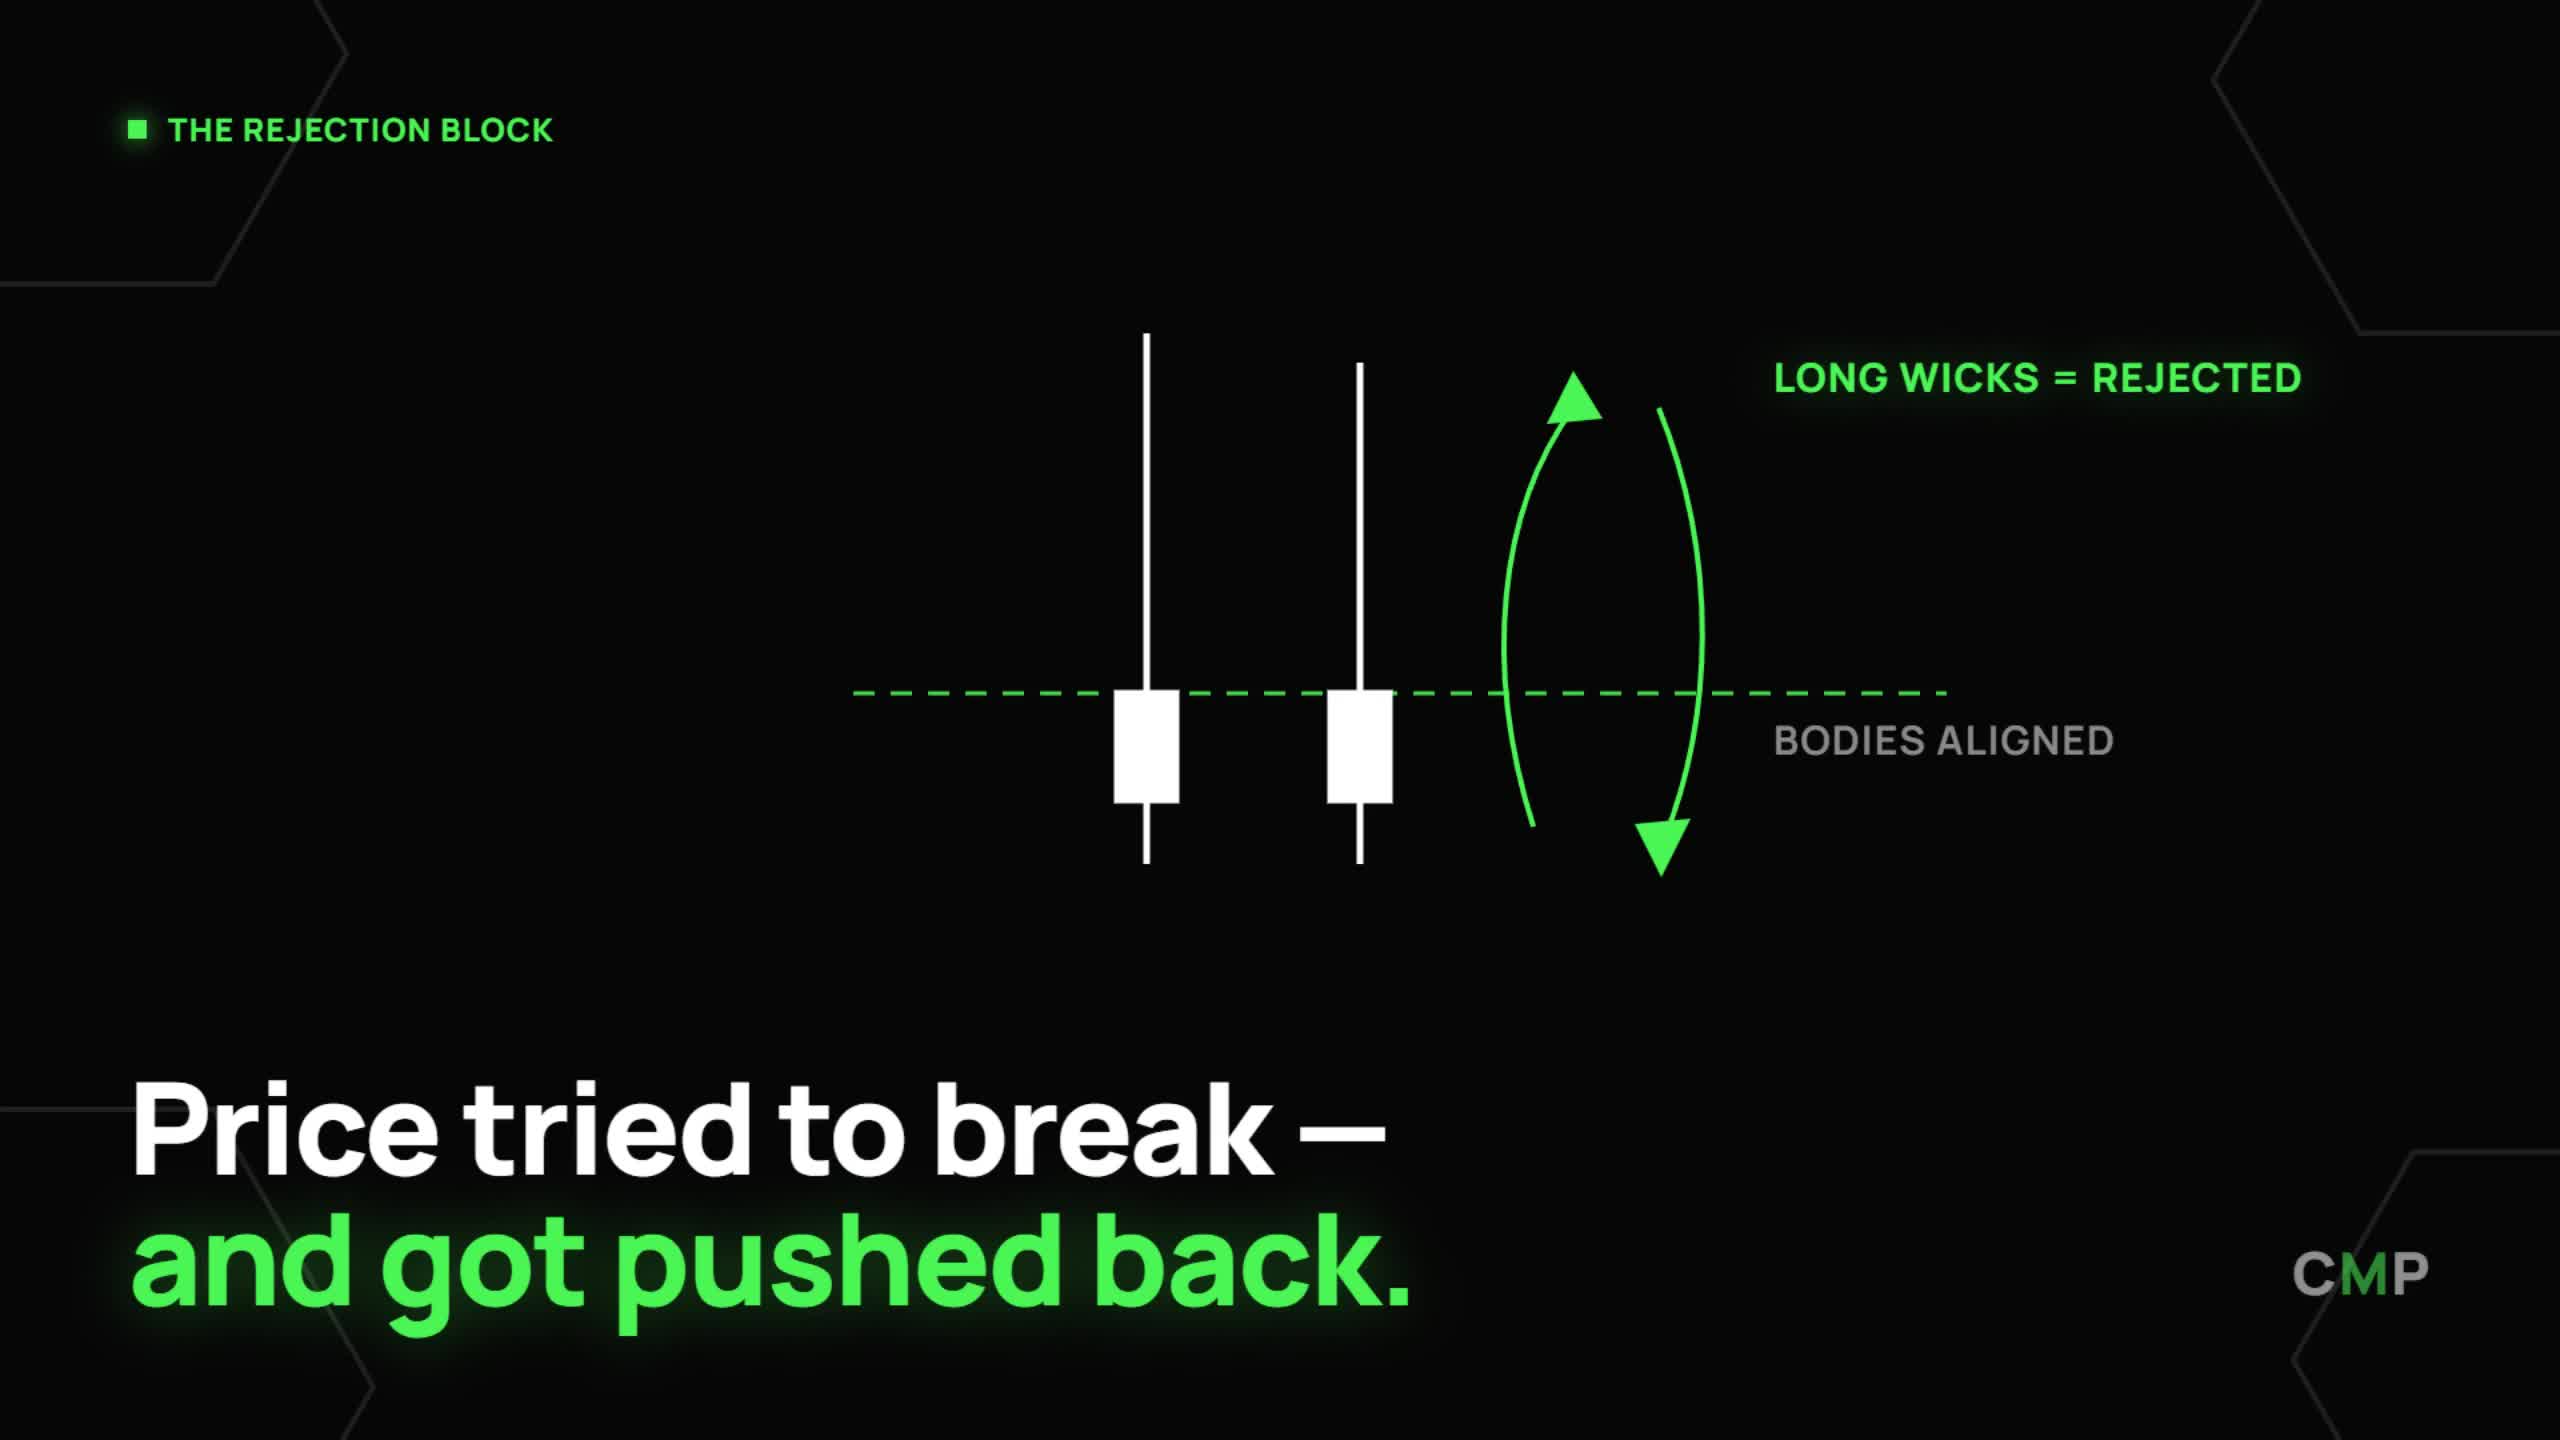
The rejection block: long wicks = price was rejected, bodies aligned. Price tried to break — and got pushed back.
The trade sequence
A trade consists of four clear steps:
- 1. Signal on 1H. A limit imbalance at the level — the first trigger.
- 2. Rejection on 4H. A rejection block confirms the level is being defended.
- 3. Limit entry. Place a limit order at the wick — where price was pushed.
- 4. Target. Take the move in the direction price was pushed toward.
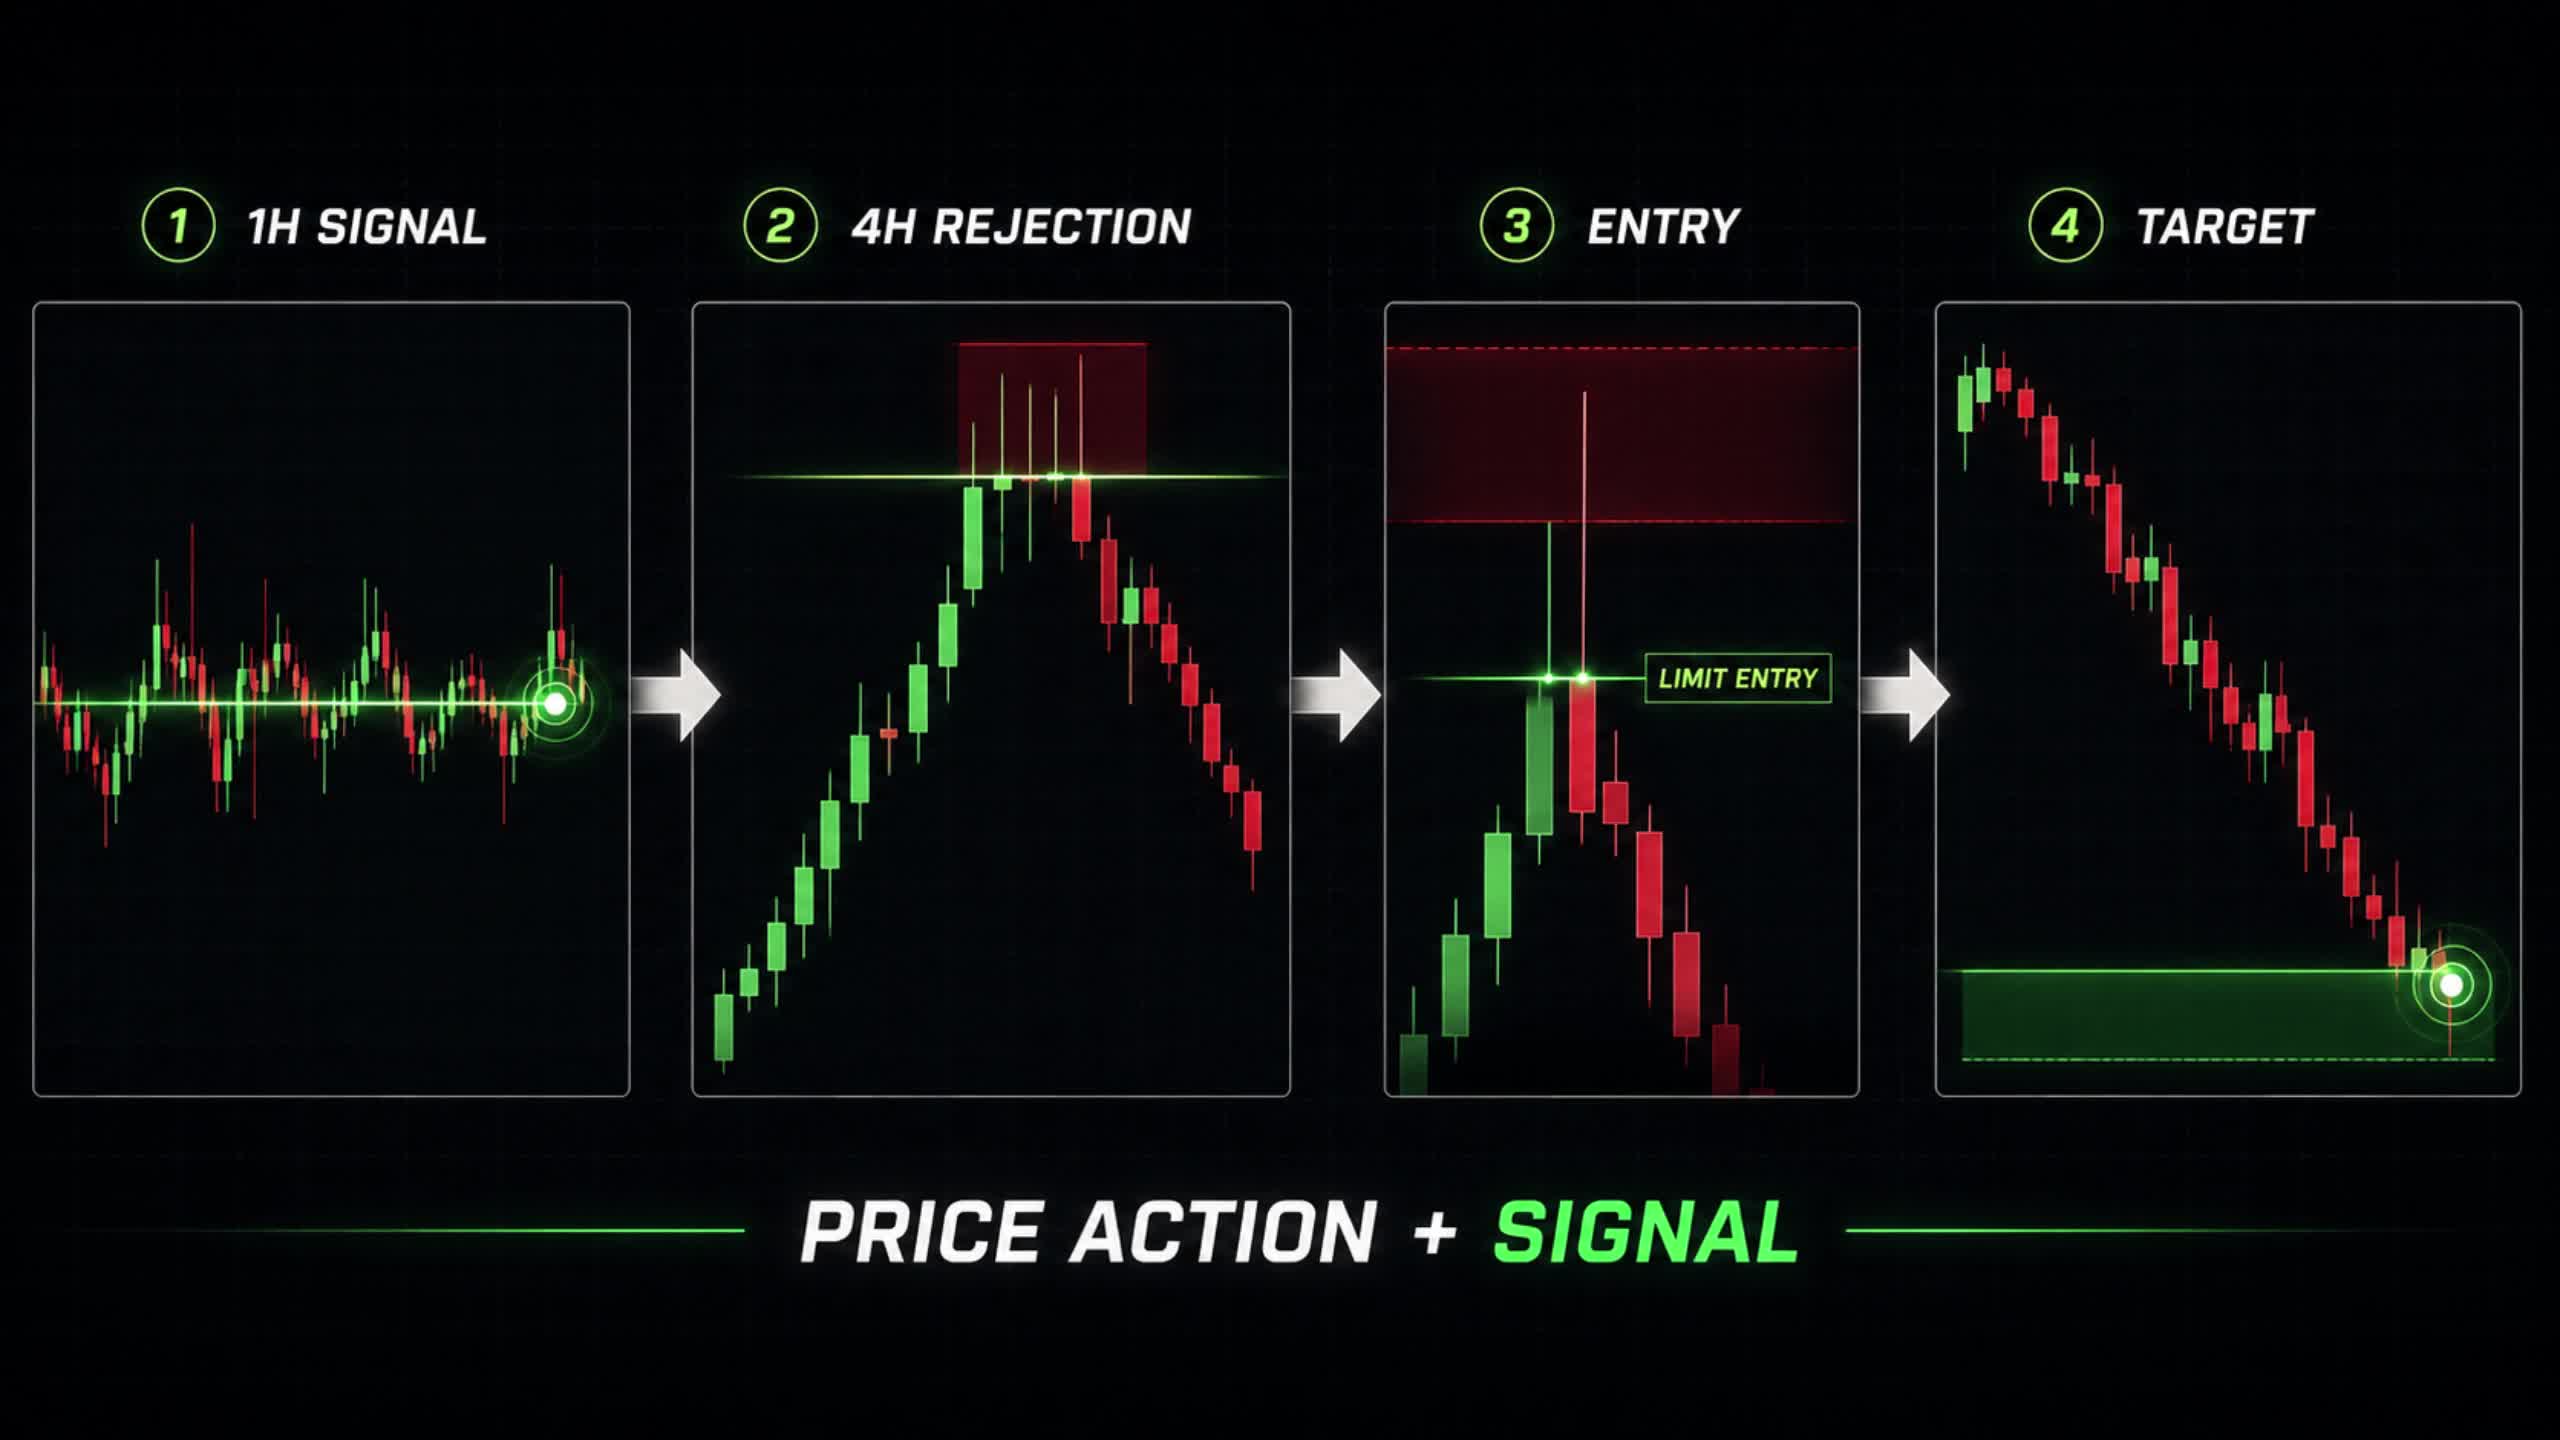
The sequence: 1H signal → 4H rejection → limit entry at the wick → target.
The stop rule: a wick can lie
The key risk rule from the video: a wick can lie — the body decides. Putting the stop beyond the tip of the wick is dangerous: long shadows are often false and are deliberately "pierced." So the stop goes by the candle body, not by the wick. Entry — at the wick (cheaper there); stop — behind the body (more reliable there).
What it looks like on a real chart
The screenshot shows BTCUSDT 4H with the CryptoMetrics Limits indicator (green and red imbalance zones at the bottom). A short is opened from the rejection zone: stop and target are set, with a risk/reward of 1.46. All of this is on a plain candle chart — no separate "order book" screen needed.
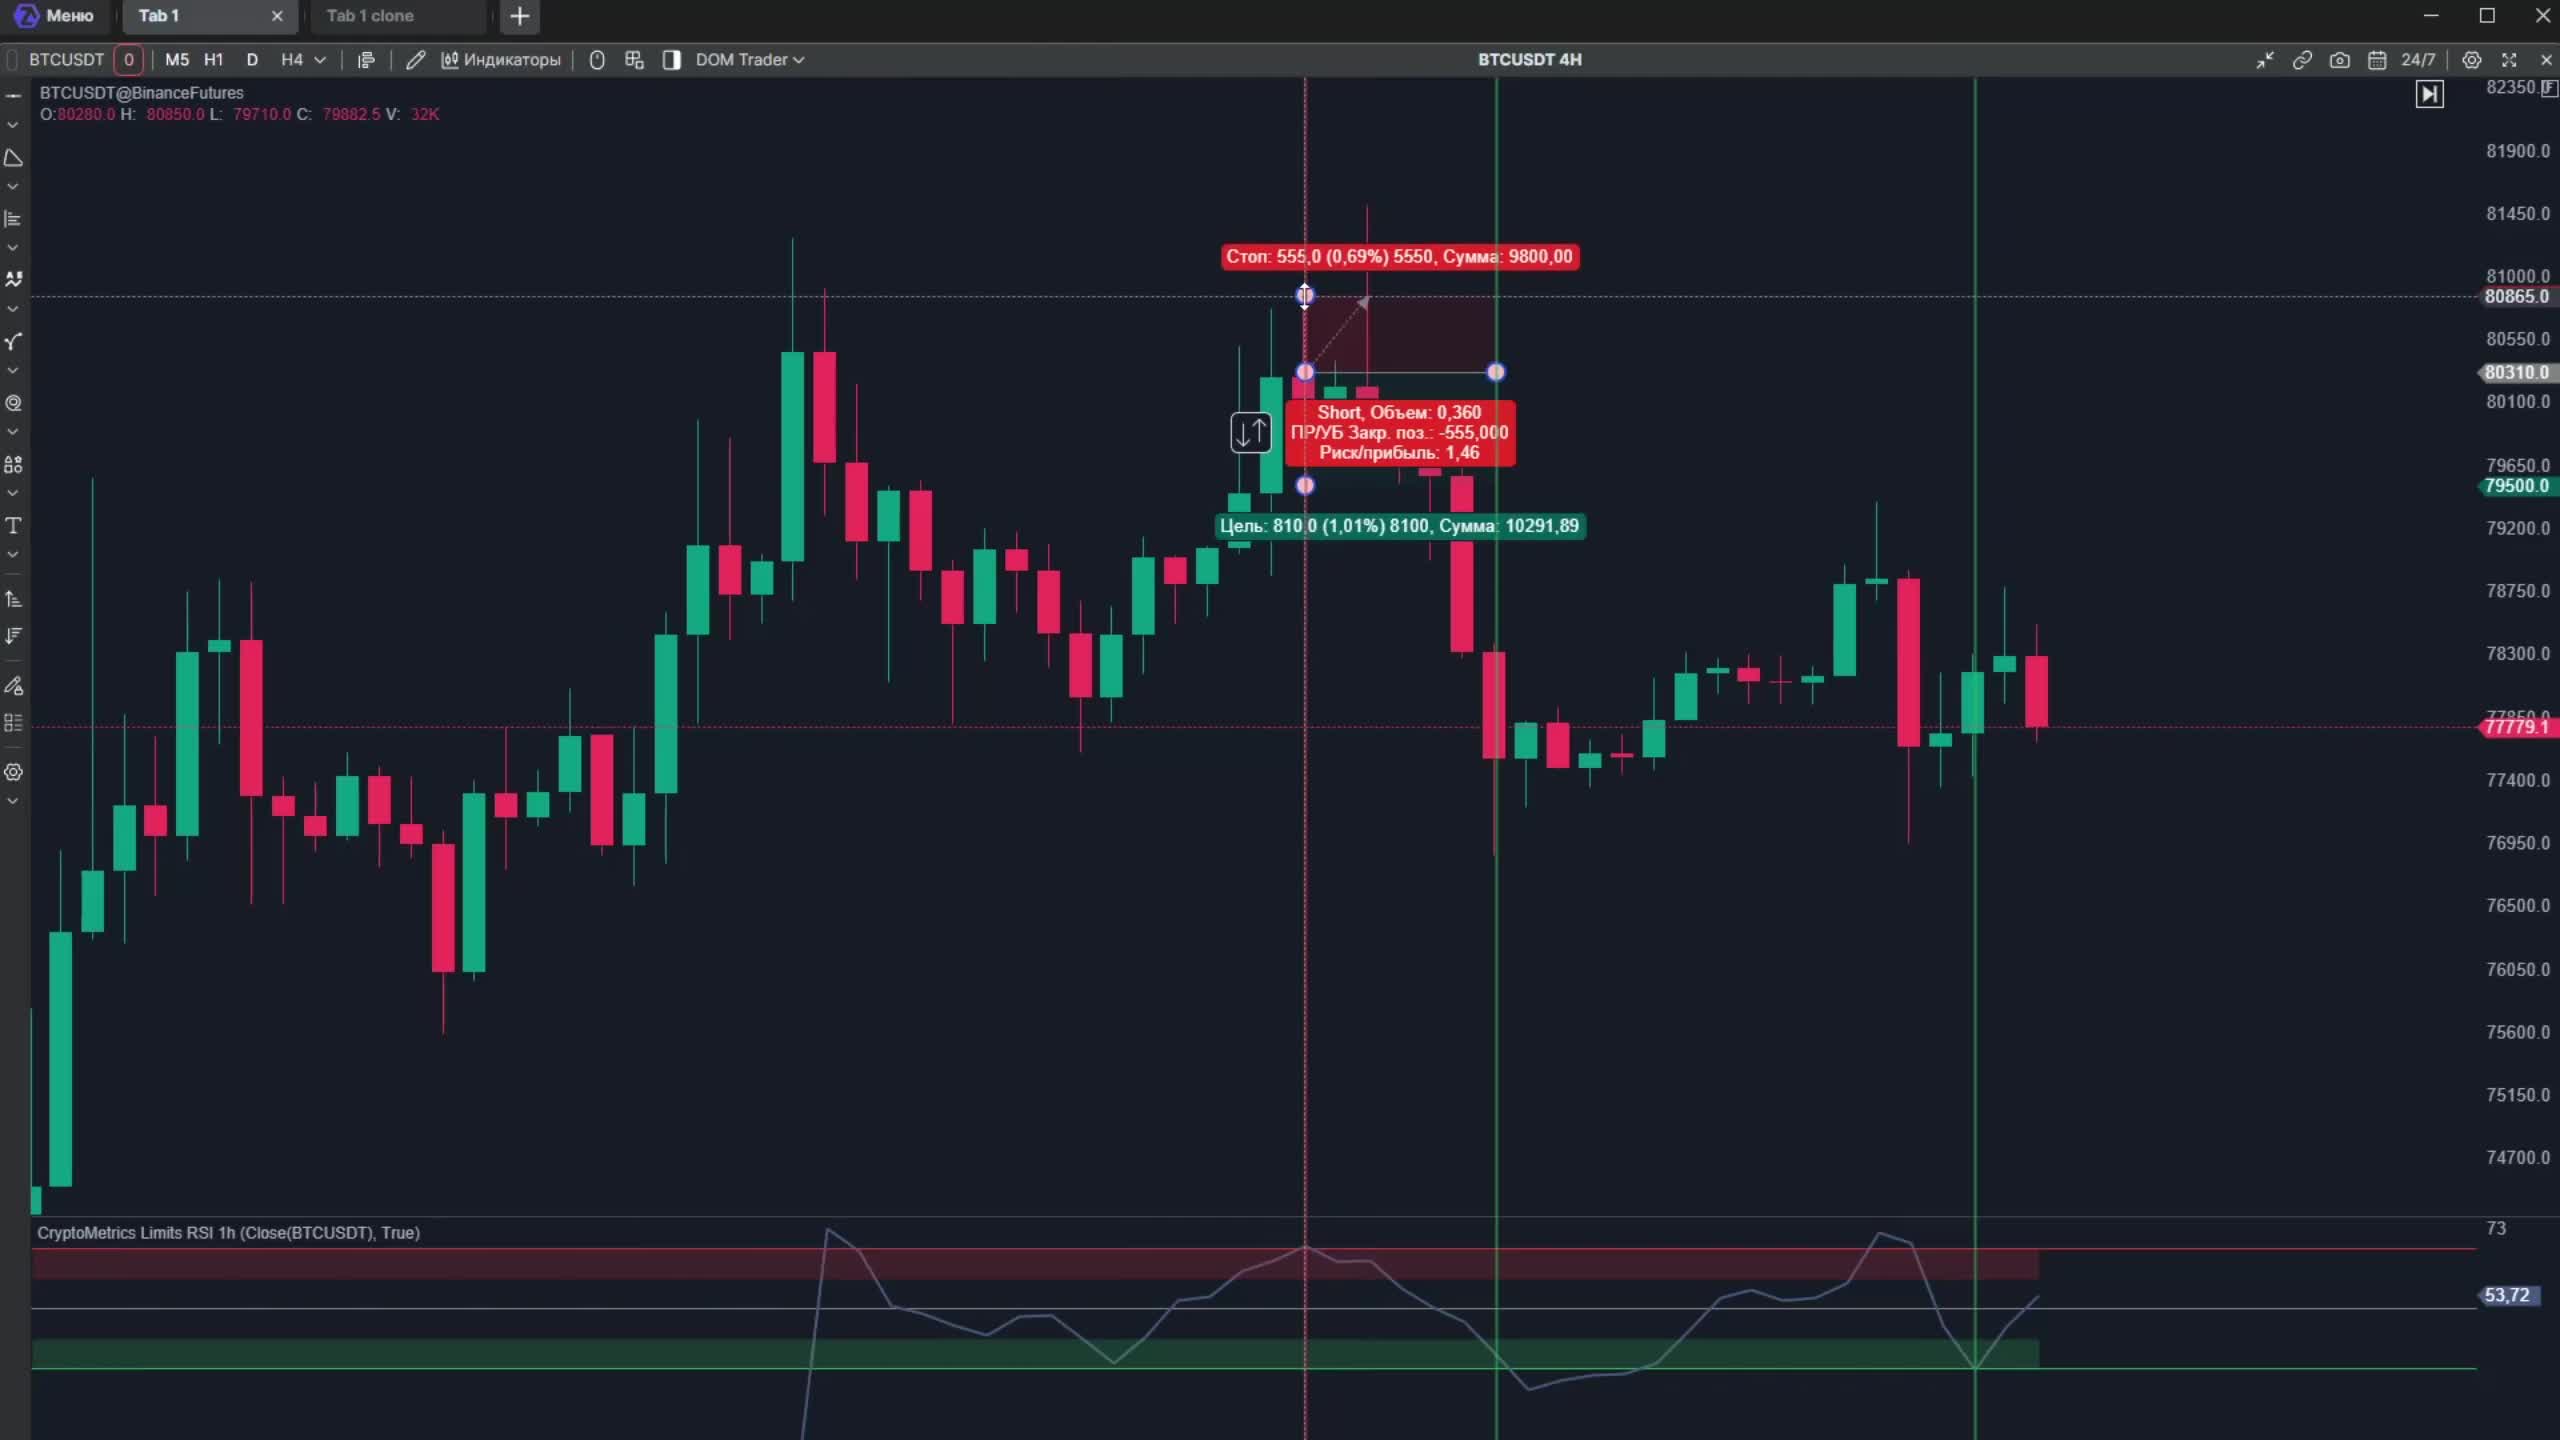
BTCUSDT 4H with the CryptoMetrics Limits indicator: a short from the rejection zone, stop and target, risk/reward 1.46.
The method in three steps
In short, the whole method is three steps:
- Signal. Limit imbalance on 1H.
- Confirm. Rejection block on 4H.
- Enter. Limit at the wick, stop by the body.
Limit-imbalance trade checklist
- I saw a limit imbalance at the level on 1H (CryptoMetrics Limits indicator).
- I waited for a rejection block on 4H — long wicks, aligned bodies.
- I placed a limit order at the wick.
- Stop — behind the candle body, not the tip of the wick.
- Target — toward where price was pushed; I checked the risk/reward.
In short
Limit imbalance is an order-book signal plotted right on the candle chart. The method is simple: an imbalance signal on 1H, confirmation by a rejection block on 4H (long wicks, aligned bodies), a limit entry at the wick and a stop by the body — because a wick can lie, while the body decides. That builds up to a few clean trades a week. The limit-imbalance indicator is on CryptoMetrics Pro.
See BTC and ETH levels live in the Order Book module.
Open moduleMore guides
This material is educational and is not individual investment advice. Trading cryptocurrencies and derivatives carries a high level of risk.