
How to Build Levels Correctly and Which One Will Work
Every beginner draws support and resistance levels by eye — and everyone ends up with different ones. As a result, price respects some levels and reverses off them, while it breaks others as if they were never there. It is not about luck: a level works when there is real options volume behind it. In this article we cover two things from the video: how to build a level correctly and which one is relevant right now.
How to build a level correctly
The main idea of the video: do not guess where the level is — see it by real volume. Each strike (an option’s exercise price) has its own gamma exposure (GEX). Where a large volume has built up at a strike is where the real level sits. In the screenshot, a specific strike shows its Net GEX value — that is the "weight" of the level. Such a level is not drawn by hand but calculated from real positions in the market.
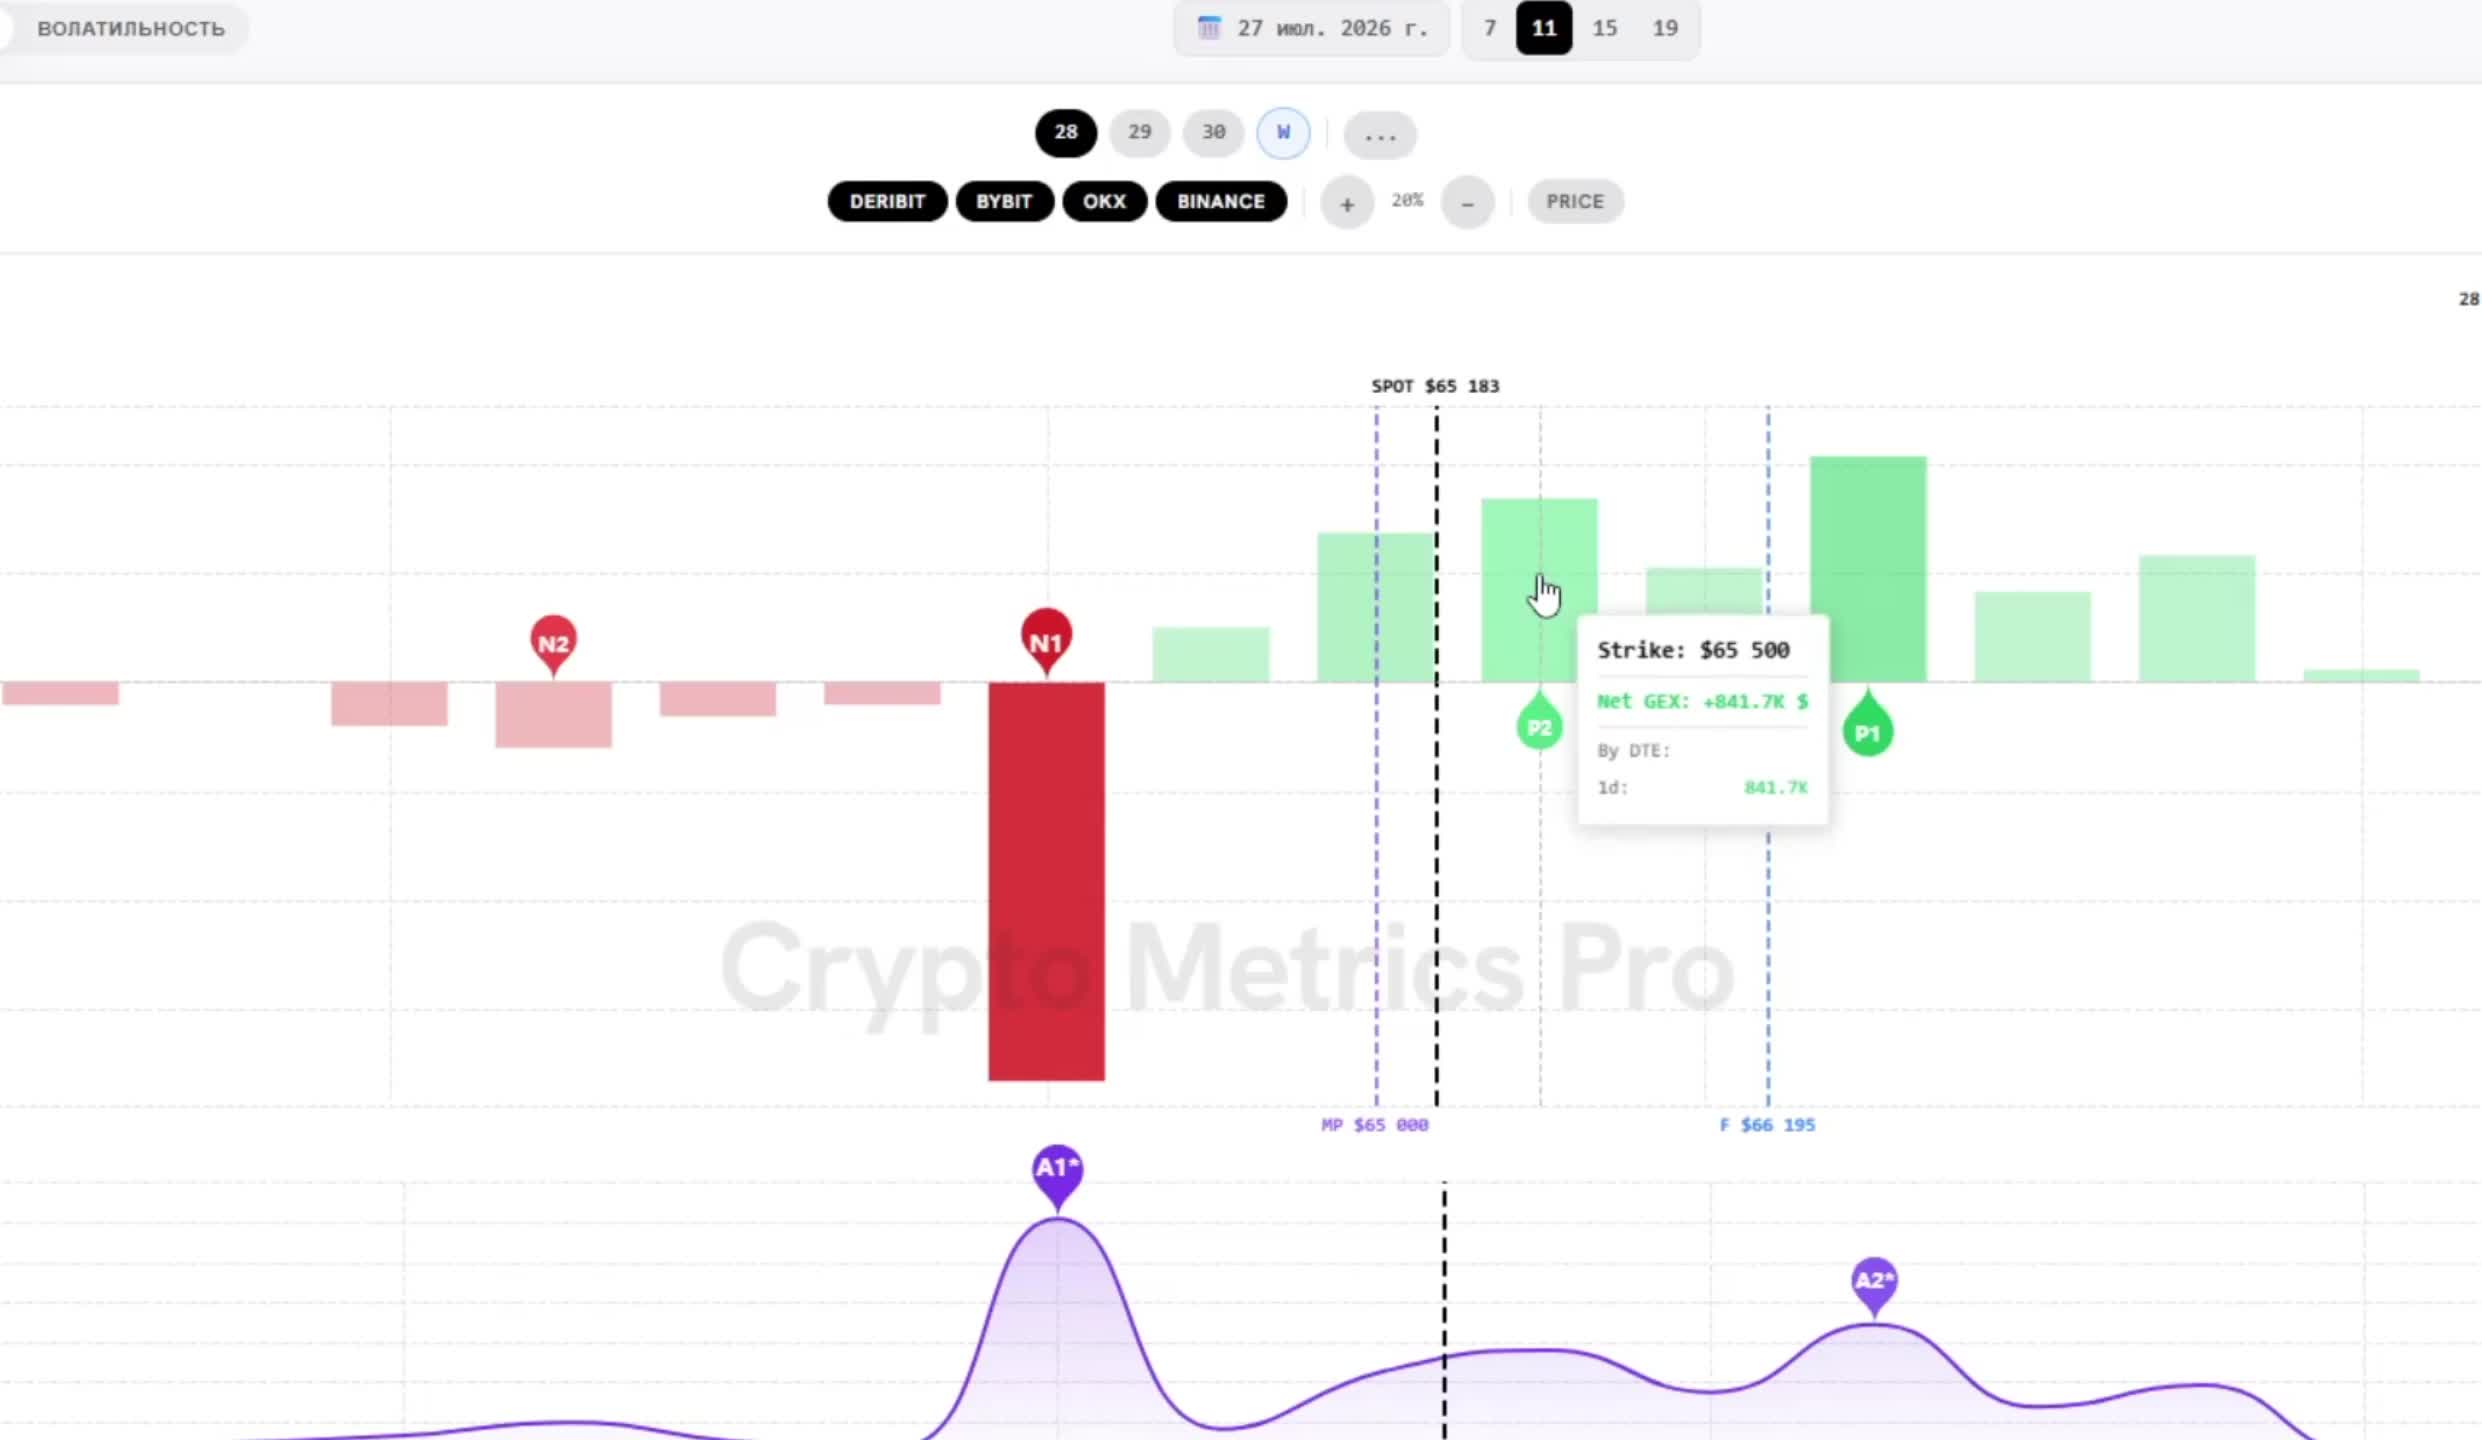
The options profile: strike $65,500 shows Net GEX +841.7K. The level is built from real volume, not by eye.
Which level matters more
Not all levels are equal. The bigger the wall, the more important the level. A large volume at a strike means strong support or resistance: price really slows down there. A small wall breaks easily — you should not rely on it as a solid level. So when you look at the profile, focus first on the tallest bars.
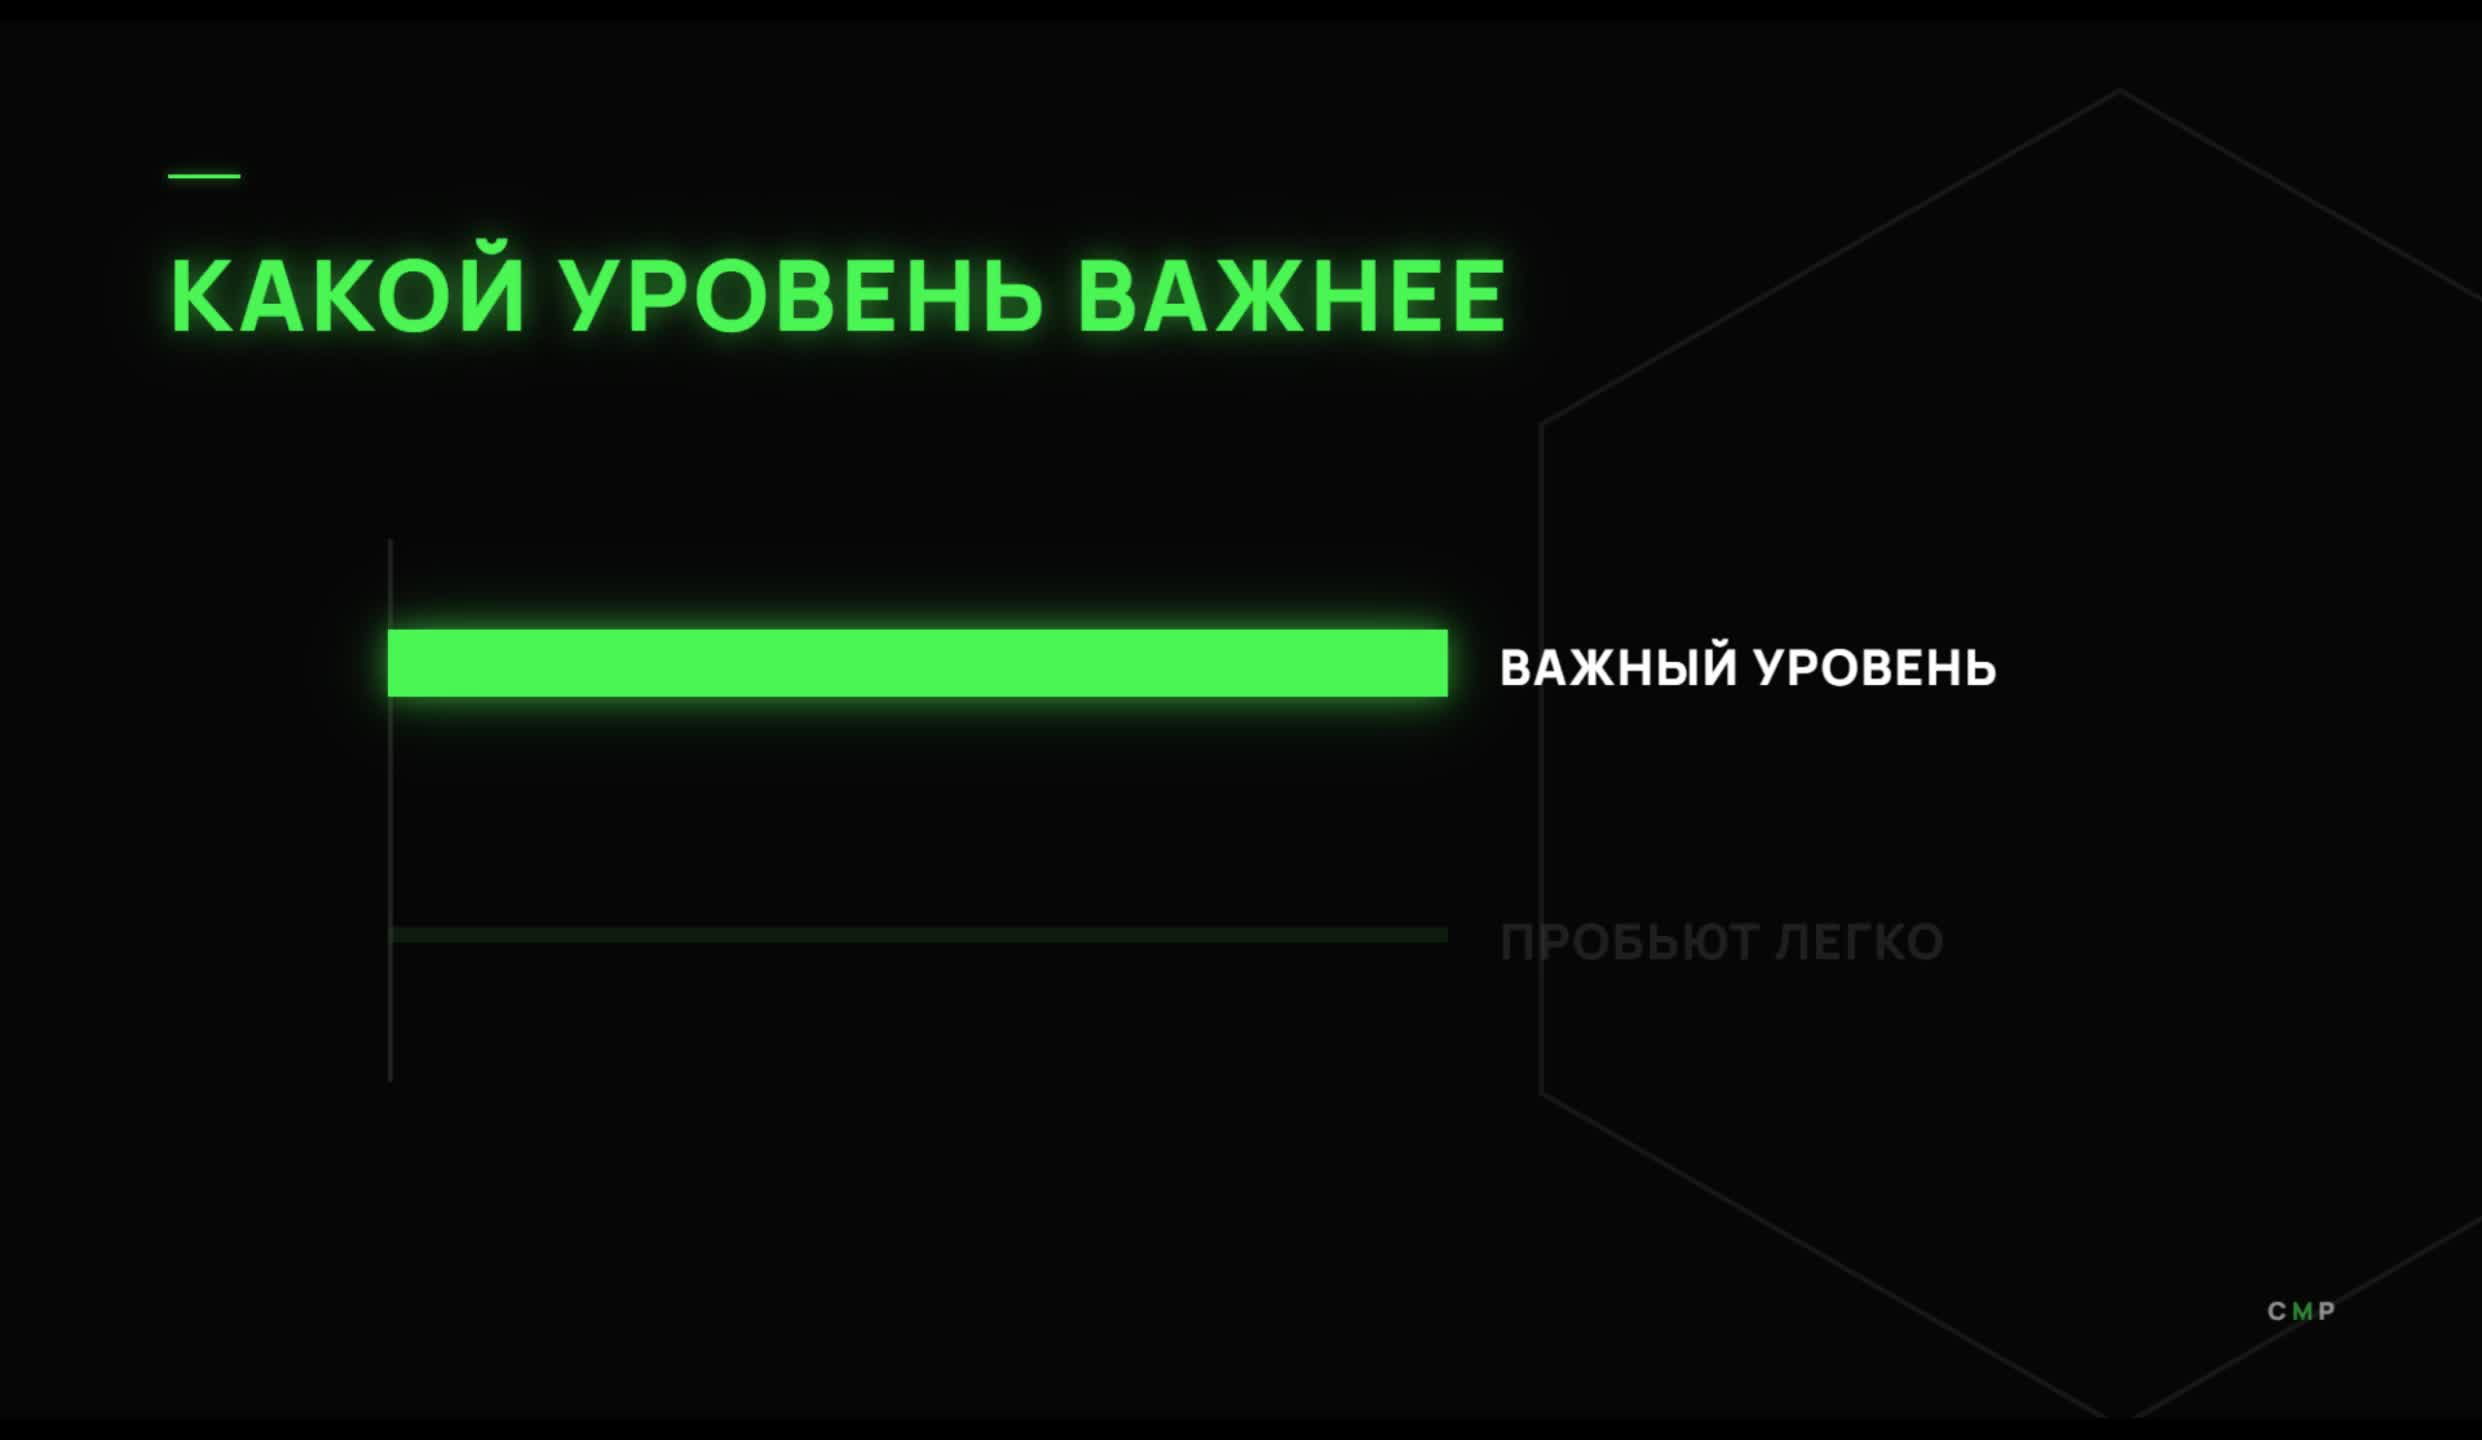
A large wall is an important level (it holds). A small one gets broken easily.
A level is not eternal
One more important idea: levels are not eternal. Option positions change, and after expiry (the options’ expiration date) the balance of power can fully reset. A level that was strong yesterday may be gone today. So the rule is simple: after expiry and after a noticeable change in positions — re-read the levels; do not trade on yesterday’s map.
What it looks like on the chart
Levels built from volume are convenient to view right on the price chart. In the GEX Terminal they are overlaid on the candles and labeled. The screenshot shows a set of current BTC levels:
- Call Wall (P1/P2). Call-option walls above — resistance ($64,000, $63,500 in the screenshot).
- Put Wall (N1/N2). Put-option walls below — support ($63,000, $62,500).
- Max Pain. The price the market is pulled toward by expiry ($63,500).
- Gamma Flip. The boundary of regimes: above calmer, below sharper ($63,250).
- Max GEX (A1/A2). Levels of maximum gamma exposure ($64,000, $63,000).
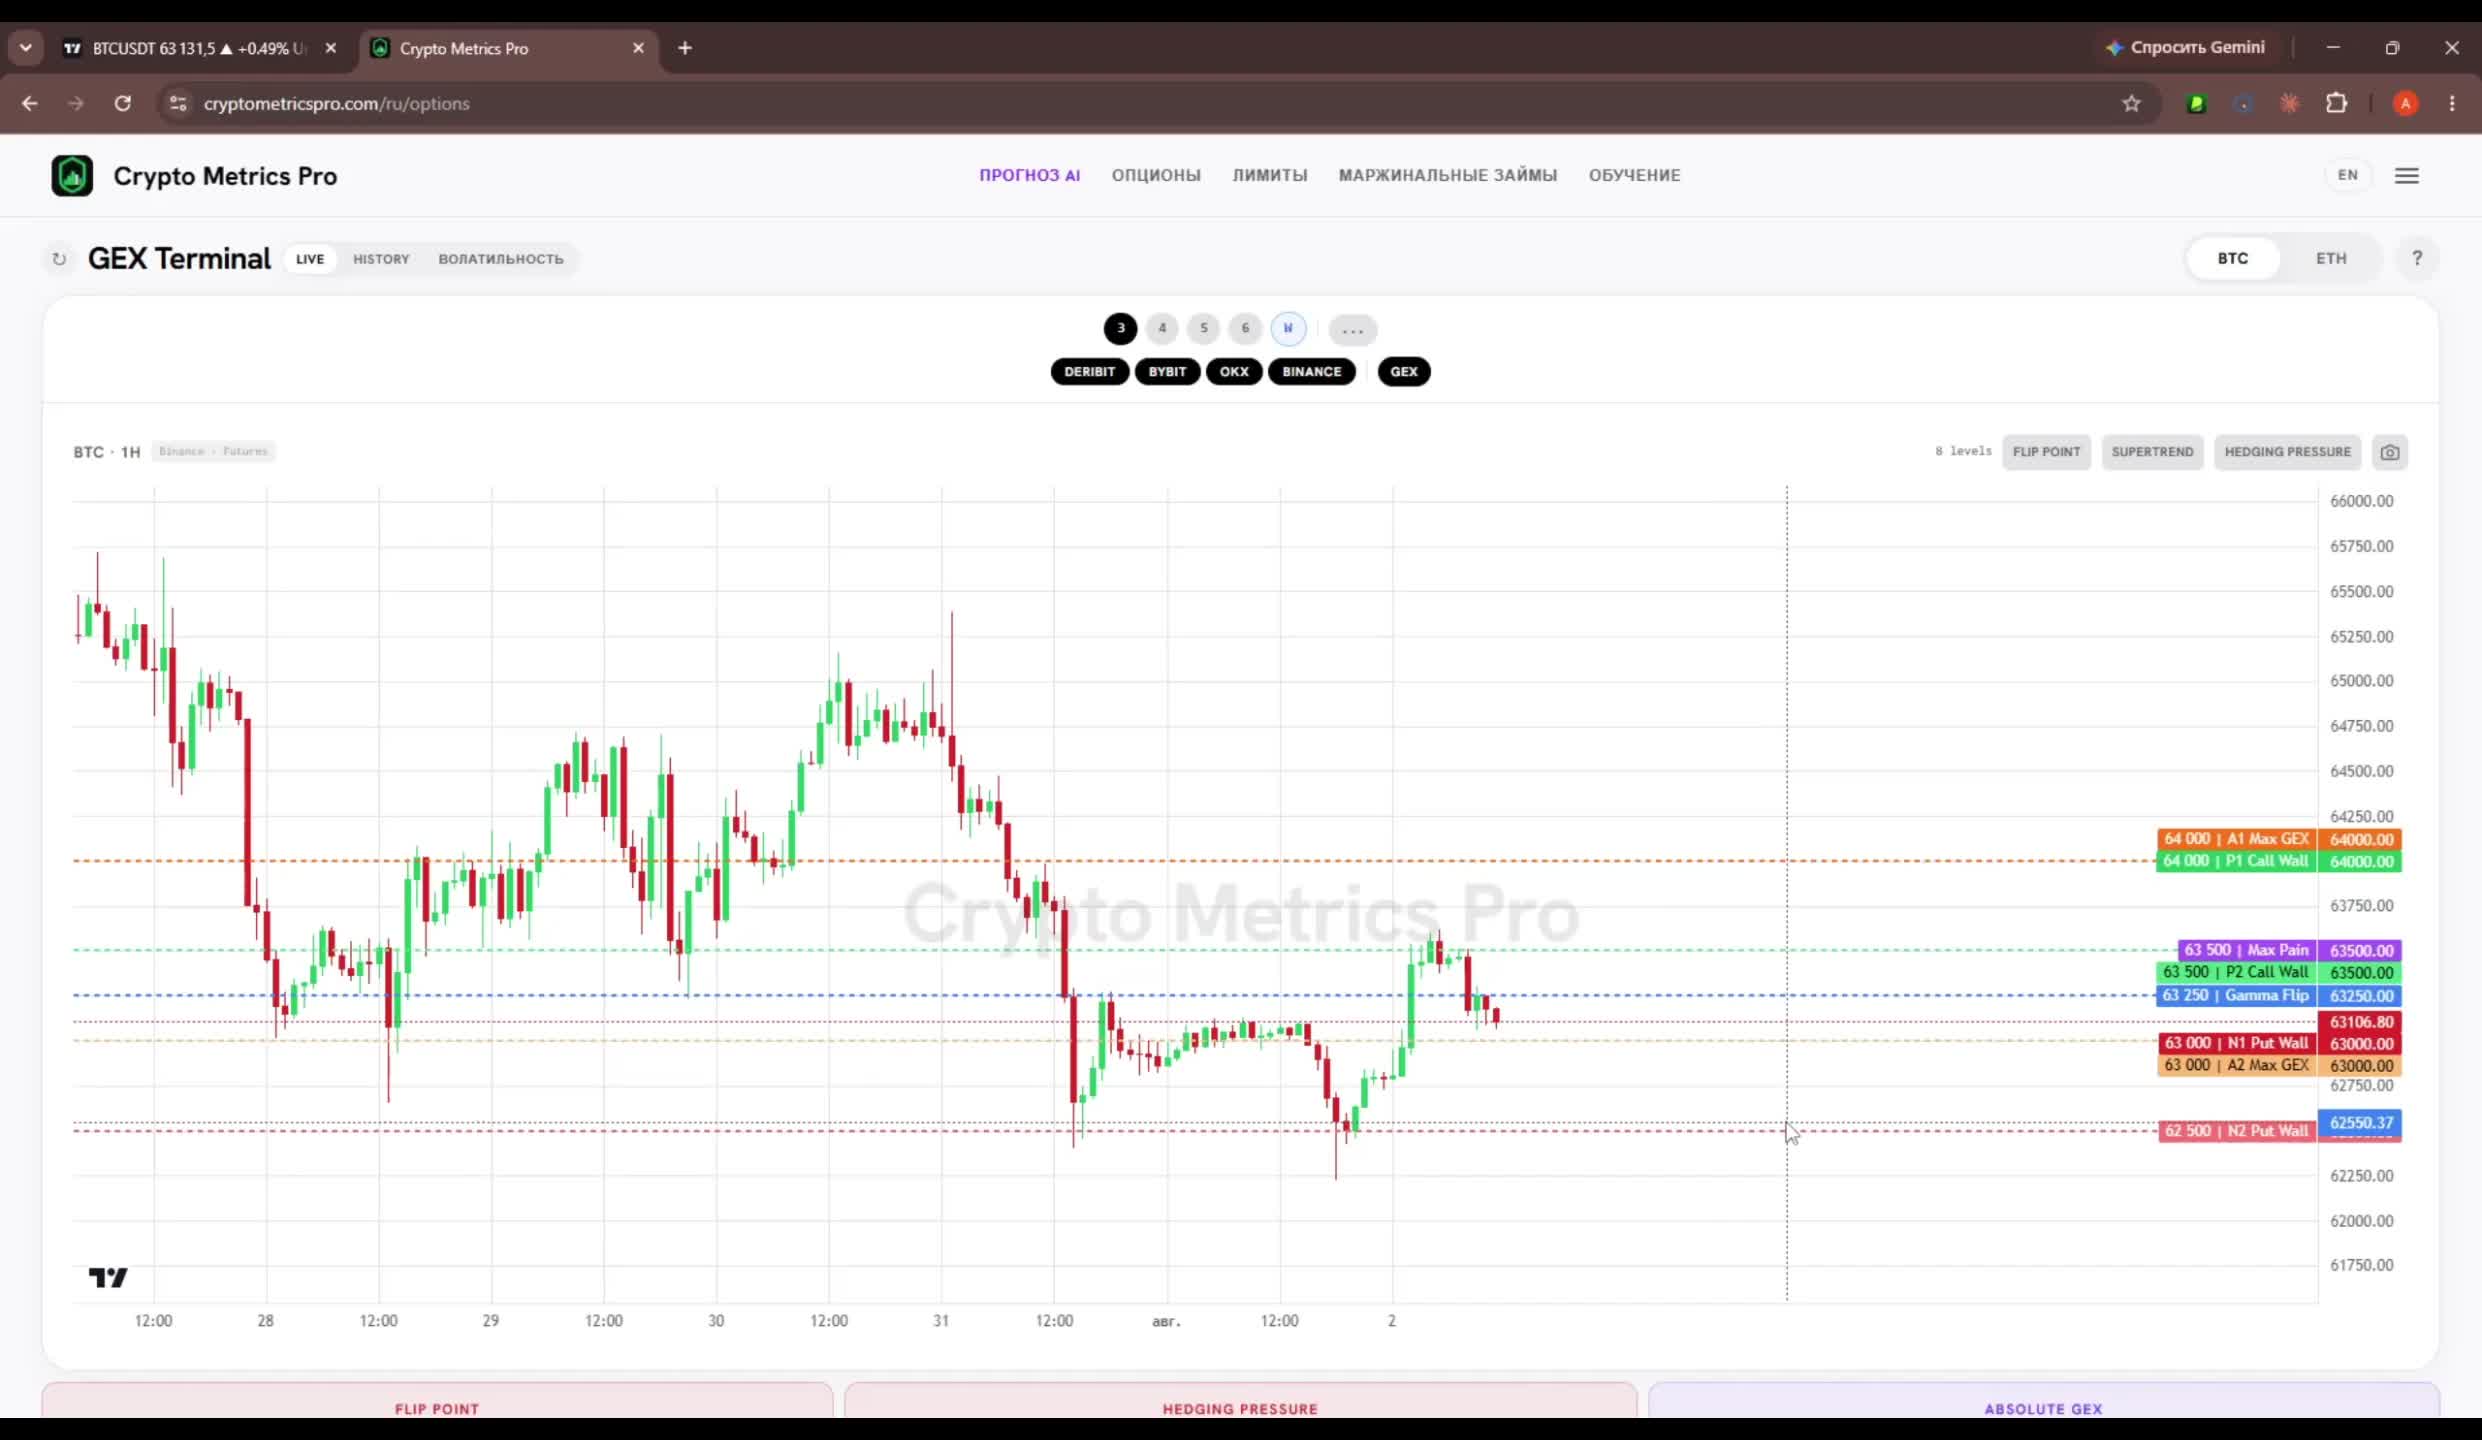
Levels built from options volume overlaid on the BTC chart: Call/Put Wall, Max Pain, Gamma Flip, Max GEX.
What a beginner should watch
To build levels correctly, a beginner only needs a few references on the dashboard:
- Options profile (walls). The tallest bars above and below — the main resistance and support levels.
- Levels overlaid on the chart. Call/Put Wall, Max Pain, Gamma Flip right on the candles — you can see where price reacts.
- Wall size. Large — a reliable level; small — broken easily.
- Expiry date. After it, levels must be re-read.
Level-building checklist
- I do not draw levels by eye — I build them from options volume (GEX).
- I focus on the largest walls — they matter more.
- I do not treat small walls as reliable: they break easily.
- I view levels on the chart (Call/Put Wall, Max Pain, Gamma Flip).
- After expiry I re-read the levels from scratch.
In short
A level works not because it was drawn nicely but because there is real options volume behind it. Build levels from the GEX profile, not by eye; the largest walls are the most important, the small ones break easily. And remember: levels are not eternal — re-read them after expiry. Ready-made levels overlaid on the Bitcoin chart are in the GEX Terminal on CryptoMetrics Pro.
See BTC and ETH levels live in the Options · GEX module.
Open moduleMore guides
This material is educational and is not individual investment advice. Trading cryptocurrencies and derivatives carries a high level of risk.