Where the market is leaning now — long or short
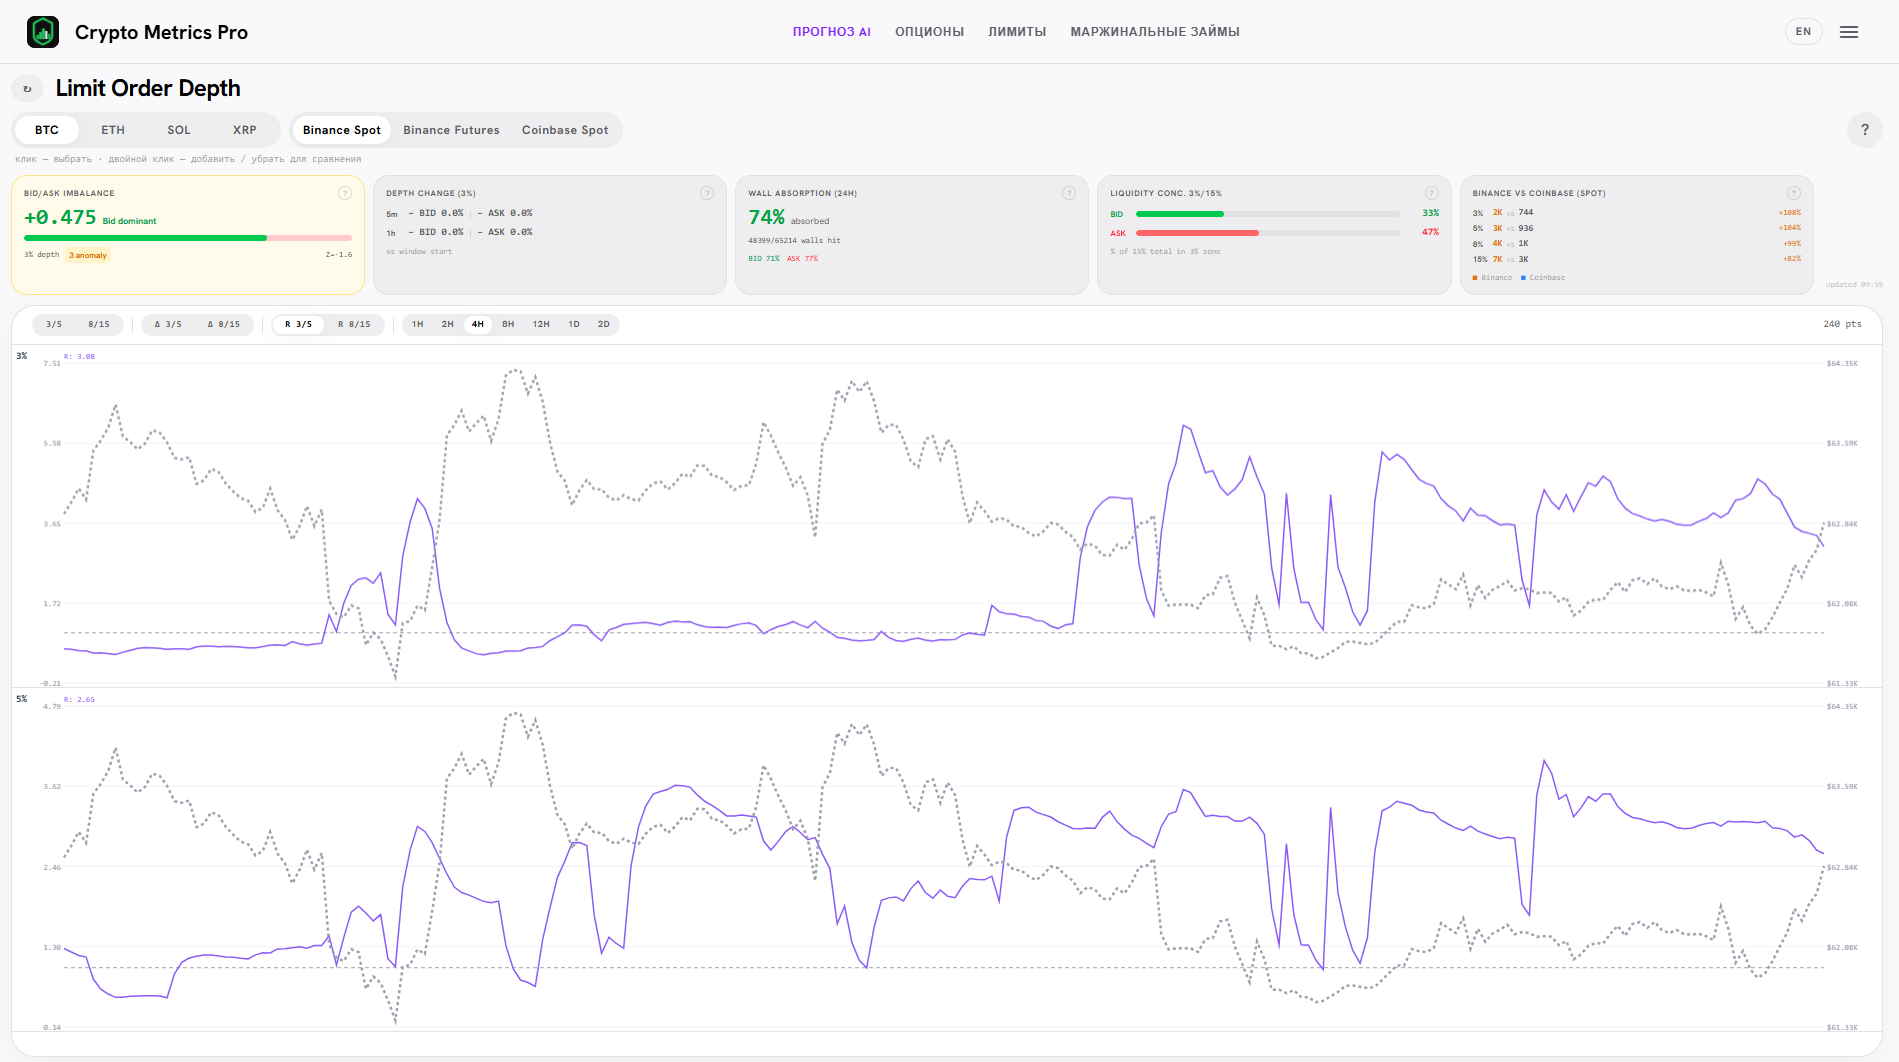
An order-book imbalance indicator below the chart: which side is heavier — buy orders or sell orders.
How it works
What this gives you
Imbalance indicator below the chart: shows which side of the book is heavier right now — bids or asks.
Signal zones are highlighted — a buyer or seller edge is visible instantly, with no math.
Ready-made presets for BTC, ETH, SOL, XRP and 30m / 4h timeframes to match your horizon.
Selected settings: win rate on the test window roughly 60 to 84% depending on the asset.
How traders use this
Frequently asked questions
It is an order-book imbalance indicator. The statistical line at the bottom of the chart shows which side of the book is heavier: buy orders (bids) or sell orders (asks). When price enters a highlighted signal zone, you see the imbalance and can act on it.
The rule is simple. Price in the bid-dominant zone — the market leans up, look for a long. Price in the ask-dominant zone — look for a short. The indicator does not predict direction on its own, it shows where the balance of force is right now.
Thirty minutes — for intra-week trading (display window of a day or a week). Four hours — for longer trades (window of a month or all history). Up top you also choose the coin: BTC, ETH, SOL, XRP.
We swept dozens of parameter configurations and kept the ones that showed a stable result on the test window — across assets the win rate landed roughly between 60 and 84 percent. Important: these are results over a limited period, not a guarantee. The market during the test window was mostly rising, so we keep validating the strength of short signals over a longer history. Treat the indicator as an imbalance filter, not a ready-made entry signal.
Available on Premium
Create free account